LJKのBlog

学无止境

安装

1
npm install json -g

使用

1
2
3
4
5
# 标准输入
<something generating JSON on stdout> | json [OPTIONS] [LOOKUPS...]

# 从文件中加载
json -f FILE [OPTIONS] [LOOKUPS...]
  • -e:修改

    1
    2
    3
    4
    5
    6
    7
    $ echo '{"name":"trent","age":38}' | json -e 'this.age++'
    {
    "name": "trent",
    "age": 39
    }

    $json -I -f tmp.json -e 'this.deploy.type="git"'
  • -c:添加

    1
    json -I -f tmp.json -c 'this.deploy.branch="main"'

资源清单是 yml 格式,api-server 会自动转成 json 格式

每个 API 对象都有 3 大类属性:元数据 metadata、规范 spec 和状态 status

spec 是期望状态,status 是实际状态,如果实际状态和期望状态有出入,控制器(通常是 deployment 控制器)的控制循环就会监控到差异,然后将需要做出的更改提交到 apiserver,调度器 scheduler 监控到 apiserver 中有未执行的操作,就会去找适合执行操作的 node,然后提交到 apiserver,kubelet 监控到 apiserver 中有关于自己节点的操作,就会执行操作,将执行结果返回给 apiserver,apiserver 再更新实际状态

deployment

1

HorizontalPodAutoscaler

1
2
3
4
5
6
7
8
9
10
11
12
13
14
15
16
17
18
19
20
21
22
23
24
kind: HorizontalPodAutoscaler
apiVersion: autoscaling/v2beta1
metadata:
namespace: linux42
name: tomcat-app1-podautoscaler
labels:
app: tomcat-app1 #自定义app标签
version: v2beta1 #自定义version标签
spec: # 对象具体信息
scaleTargetRef: #定义水平伸缩的目标对象:Deployment、ReplicationController/ReplicaSet
kind: Deployment #目标对象类型为deployment
apiVersion: apps/v1 #API版本
name: tomcat-app1-deployment #deployment的名称
minReplicas: 2 #最小pod数
maxReplicas: 5 #最大pod数
metrics: #需要安装metrics server
- type: Resource # 类型为资源
resource: # 定义资源
name: cpu
targetAverageUtilization: 80 #CPU使用率,超过80%就增加pod
- type: Resource
resource:
name: memory
targetAverageValue: 1024Mi # 内存使用量,超过1024Mi就增加pod

namespace

1
2
3
4
apiVersion: v1
kind: Namespace
metadata:
name: test

Nginx 业务 yaml 文件

1
2
3
4
5
6
7
8
9
10
11
12
13
14
15
16
17
18
19
20
21
22
23
24
25
26
27
28
29
30
31
32
33
34
35
36
37
38
39
40
41
42
43
44
45
46
47
48
49
50
51
52
53
54
55
56
57
58
59
60
61
62
63
64
65
66
kind: Deployment
apiVersion: extensions/v1beta1 # API版本
metadata: # deployment元数据
name: nginx-deployment # deployment名称,创建后的pdo名称是这个名称加随机字符串
namespace: test # pod的namespace,默认是default
labels: # 自定义deployment标签
app: nginx-deployment-label
spec: # deployment的详细信息
replicas: 1 # 创建出的pod的副本数,即多少个pod,默认值为1
selector: # Deployment如何查找要管理的Pods,它必须与pod模板的标签相匹配
matchLabels: # 定义匹配Pod的标签,pod模板的标签相匹配
app: nginx-selector # 就是下面的 template.metadata.labels.app
template: # 定义模板,必须定义,用于描述要创建的pod
metadata: # pod元数据
labels: # 自定义pod的标签,主要用于service匹配
app: nginx-selector # 自定义app标签
spec: # pod详细信息
containers: # pod中容器列表,可以多个,至少一个,绝大部分情况是一个,pod不能动态增减容器
- name: nginx-container # 容器名称
image:
harbor.magedu.net/test/nginx-web1:v1 # 镜像地址
# command: ["/apps/tomcat/bin/run_tomcat.sh"] # 容器启动执行的命令或脚本
# imagePullPolicy: IfNotPresent
imagePullPolicy: Always # 拉取镜像策略
ports: # 定义容器端口列表
- name: http # 端口名称
containerPort: 80
protocol: TCP
- name: https # 端口名称
containerPort: 443
protocol: TCP
env: # 配置环境变量
- name: "password" # 变量名称。必须要用引号引起来
value: "123456"
- name: "age"
value: "18"
resources: # 对资源的请求设置和限制设置
limits: # 资源限制设置上限
cpu: 2 # cpu的限制,单位为core数,可以写0.5或者500m等CPU压缩值
memory: 2Gi # 内存限制,单位可以为Mib/Gib,将用于docker run --memory参数
requests: # 资源请求的设置
cpu: 1 # cpu请求数,容器启动的初始可用数量,可以写0.5或者500m等CPU压缩值
memory: 512Mi # 内存请求大小,容器启动的初始可用数量,用于调度pod时候使用
---
kind: Service
apiVersion: v1 # API版本
metadata: # service元数据
name: nginx-spec # service的名称,此名称会被DNS解析
namespace: test # 该service隶属于的namespaces名称,即把service创建到哪个namespace里面
labels: # 自定义service标签
app: nginx
spec: # service的详细信息
type: NodePort # service的类型,定义服务的访问方式,默认为ClusterIP
ports: # 定义访问端口
- name: http # 定义一个端口名称
port: 80 # service 80端口
protocol: TCP # 协议类型
targetPort: 80 # 目标pod的端口
nodePort: 30001 # node节点暴露的端口
- name: https
port: 443
protocol: TCP
targetPort: 443
nodePort: 30043
selector: # service的标签选择器,匹配Pod的标签
app: nginx-selector # 匹配定义了app标签且值为nginx-selector的Pod

Master PDF Editor,强大的多功能 PDF 编辑器,轻松查看,创建,修改,批注,签名,扫描,OCR 和打印 PDF 文档。高级注释工具,可以添加任意便笺指示对象突出显示,加下划线和删除,而无需更改源 PDF 文件

添加目录

左键选中文字,右键添加书签

批量去除水印

VXLAN

vxlan 是属于 overlay 中的一种隧道封装技术,实际上将 L2(数据链路层)的以太网帧封装成 L4(传输层)的 UDP 数据报文,然后在 L3 网络层传输,最终实现的效果就类似于在 L2 的以太网传输报文一样,但是不受 L3 网络层限制

1
2
为什么是在L3传输?
因为传输是基于路由表,路由只涉及ip,不涉及端口

vxlan 标志位有 24 位,可以划分 2^24 个虚拟局域网

1
2
3
4
5
1. 感觉封装UDP是多余的,只靠IP也能通信
因为Vxlan的封装思维是将原始数据报文当做用户数据包,VTEP当做大二层接入,那么VTEP会依次进行传输层封装,网络层封装,以太网头部封装,如果直接进行IP封装则跳过了传输层的封装过程,会在传输的过程中遇到一些困难,很多数据中心里都会有大量的冗余链路,交换机面对多条等价路径时会进行基于五元组进行HASH,此时会出现问题;其次,在遇到NAT设备时,无法穿透也会造成影响

2. 为什么封装成UDP,而不是TCP
因为封装UDP开销比较小,至于TCP比UDP更可靠,但是依靠原始数据报文的TCP也可以实现可靠性的要求

网络模型

docker 的网络模型

  • Bridge:桥接
  • Host:主机
  • Container:容器

kubernetes 网络模型

kubernetes 的网络模型主要用于解决四类通信需求

Pod 内通信

命名空间:linux 底层概念,在内核层实现,容器使用 namespce 技术实现容器间相互隔离

  • mnt namespace:隔离根,即 chroot 技术
  • ipc namespace:隔离进程间通信
  • uts namespace:隔离系统信息,主机名等信息
  • pid namespace:隔离进程号
  • net namespace:隔离网络
  • user namespce:隔离用户

运行在同一个 pod 内的容器,共享 net、ipc、uts、一组存储卷,亲密关系,同进同退

Pod 间通信 ★★★

网络模型:所有 Pod 在一个平面网络中,每个 Pod 拥有一个集群全局唯一的地址,可直接与其他 Pod 通信

k8s 设计了网络模型,但将其实现交给网络插件,主流的网络插件有:flannel、calico、kube-router 等

flannel

早期版本的 Flannel 使用 UDP 封装完成报文的跨越主机转发,其安全性及性能略有不足,现在已经废弃这种方式了,现在只能通过 vxlan 或 host-gw 进行通信

  • flannel VXLAN 后端:

  • flannel VXLAN Direct Routing 后端:

    Directrouting 为在同一个二层网络中的 node 节点启用直接路由机制,类似于 host-gw 模式

  • host-gw 后端:

    类似 calico,通过路由表完成报文转发

calico

Calico 本身是一个三层的虚拟网络方案,它将每个节点都当作路由器(router),将每个节点的容器都当作是“节点路由器”的一个终端并为其分配一个 IP 地址,各节点路由器通过BGP(BorderGateway Protocol)学习生成路由规则,从而将不同节点上的容器连接起来

BGP 是互联网上一个核心的去中心化自治路由协议,性能非常高,需要物理路由器的支持,这也是公有云不提供 calico 的原因,因为公有云上节点连接的都是虚拟路由器

calico 核心组件:

  • Felix:calico 的 agent,维护路由规则、汇报当前节点状态
  • Etcd:路由规则储存在 etcd
  • BGP Client:运行在每个 node 上,负责监听由 felix 生成的路由信息,然后通过 BGP 协议广播至其他 node 节点,其他 node 的 Felix 会自动更新路由规则,从而实现路由的相互学习
  • Route Reflector:集中式的路由反射器,维护全网的路由规则,替换路由广播,如果节点非常多,可以考虑使用

BGP 模式下 calico 的通信过程:

1
2
3
4
5
6
# traceroute命令查看请求ip为10.10.74.193的pod
/ $ traceroute 10.10.74.193
traceroute to 10.10.74.193 (10.10.74.193), 30 hops max, 46 byte packets
1 10.0.1.32 (10.0.1.32) 0.005 ms 0.006 ms 0.002 ms # 当前pod所在节点的ip
2 10.0.1.33 (10.0.1.33) 1.220 ms 0.254 ms 0.147 ms # 对方pod所在节点的ip
3 10.10.74.193 (10.10.74.193) 0.207 ms 0.308 ms 0.163 ms # 对方pod的ip

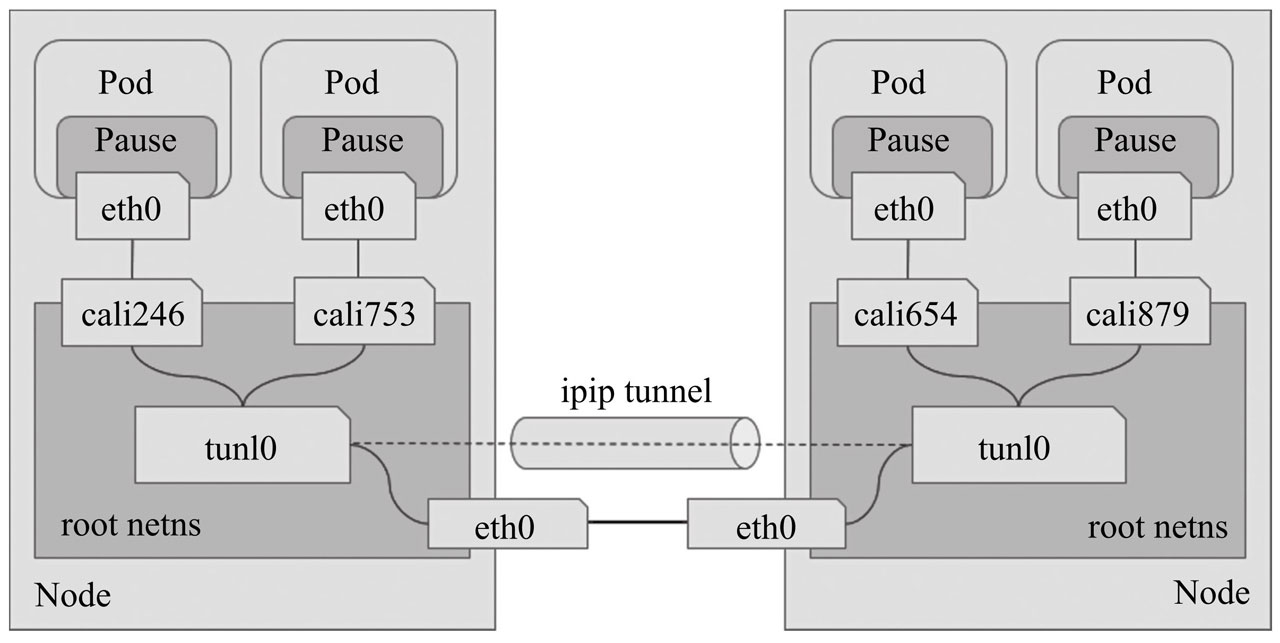
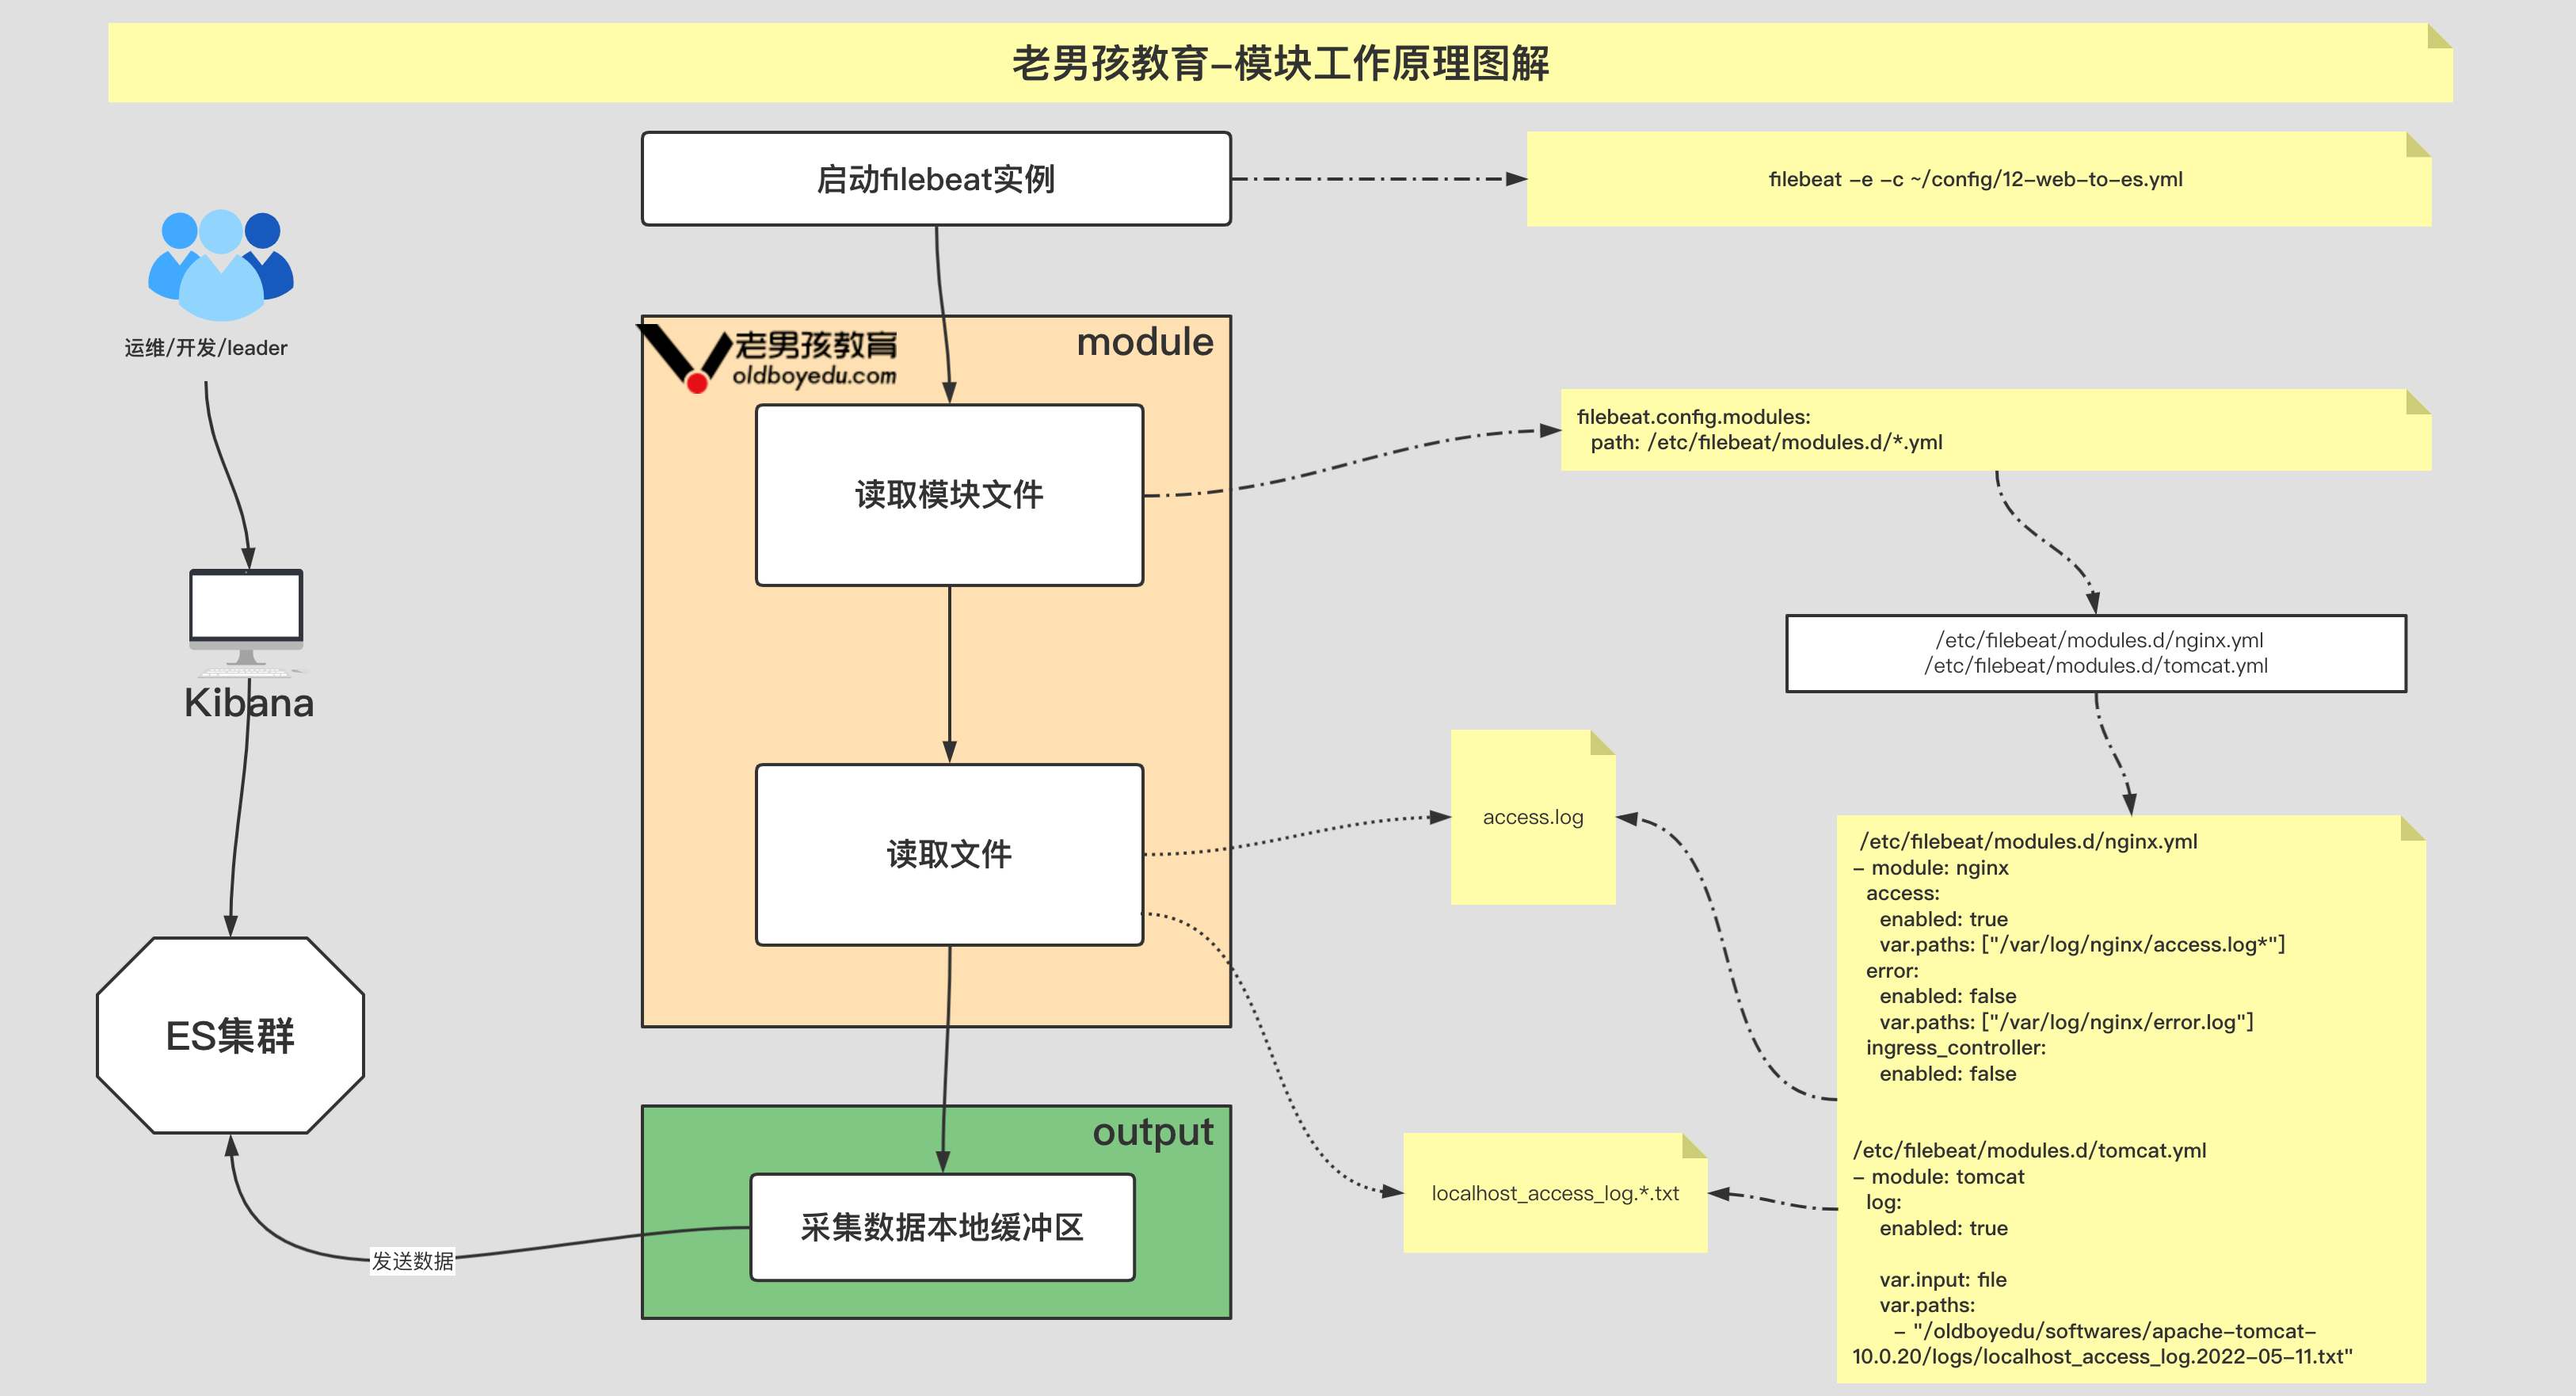
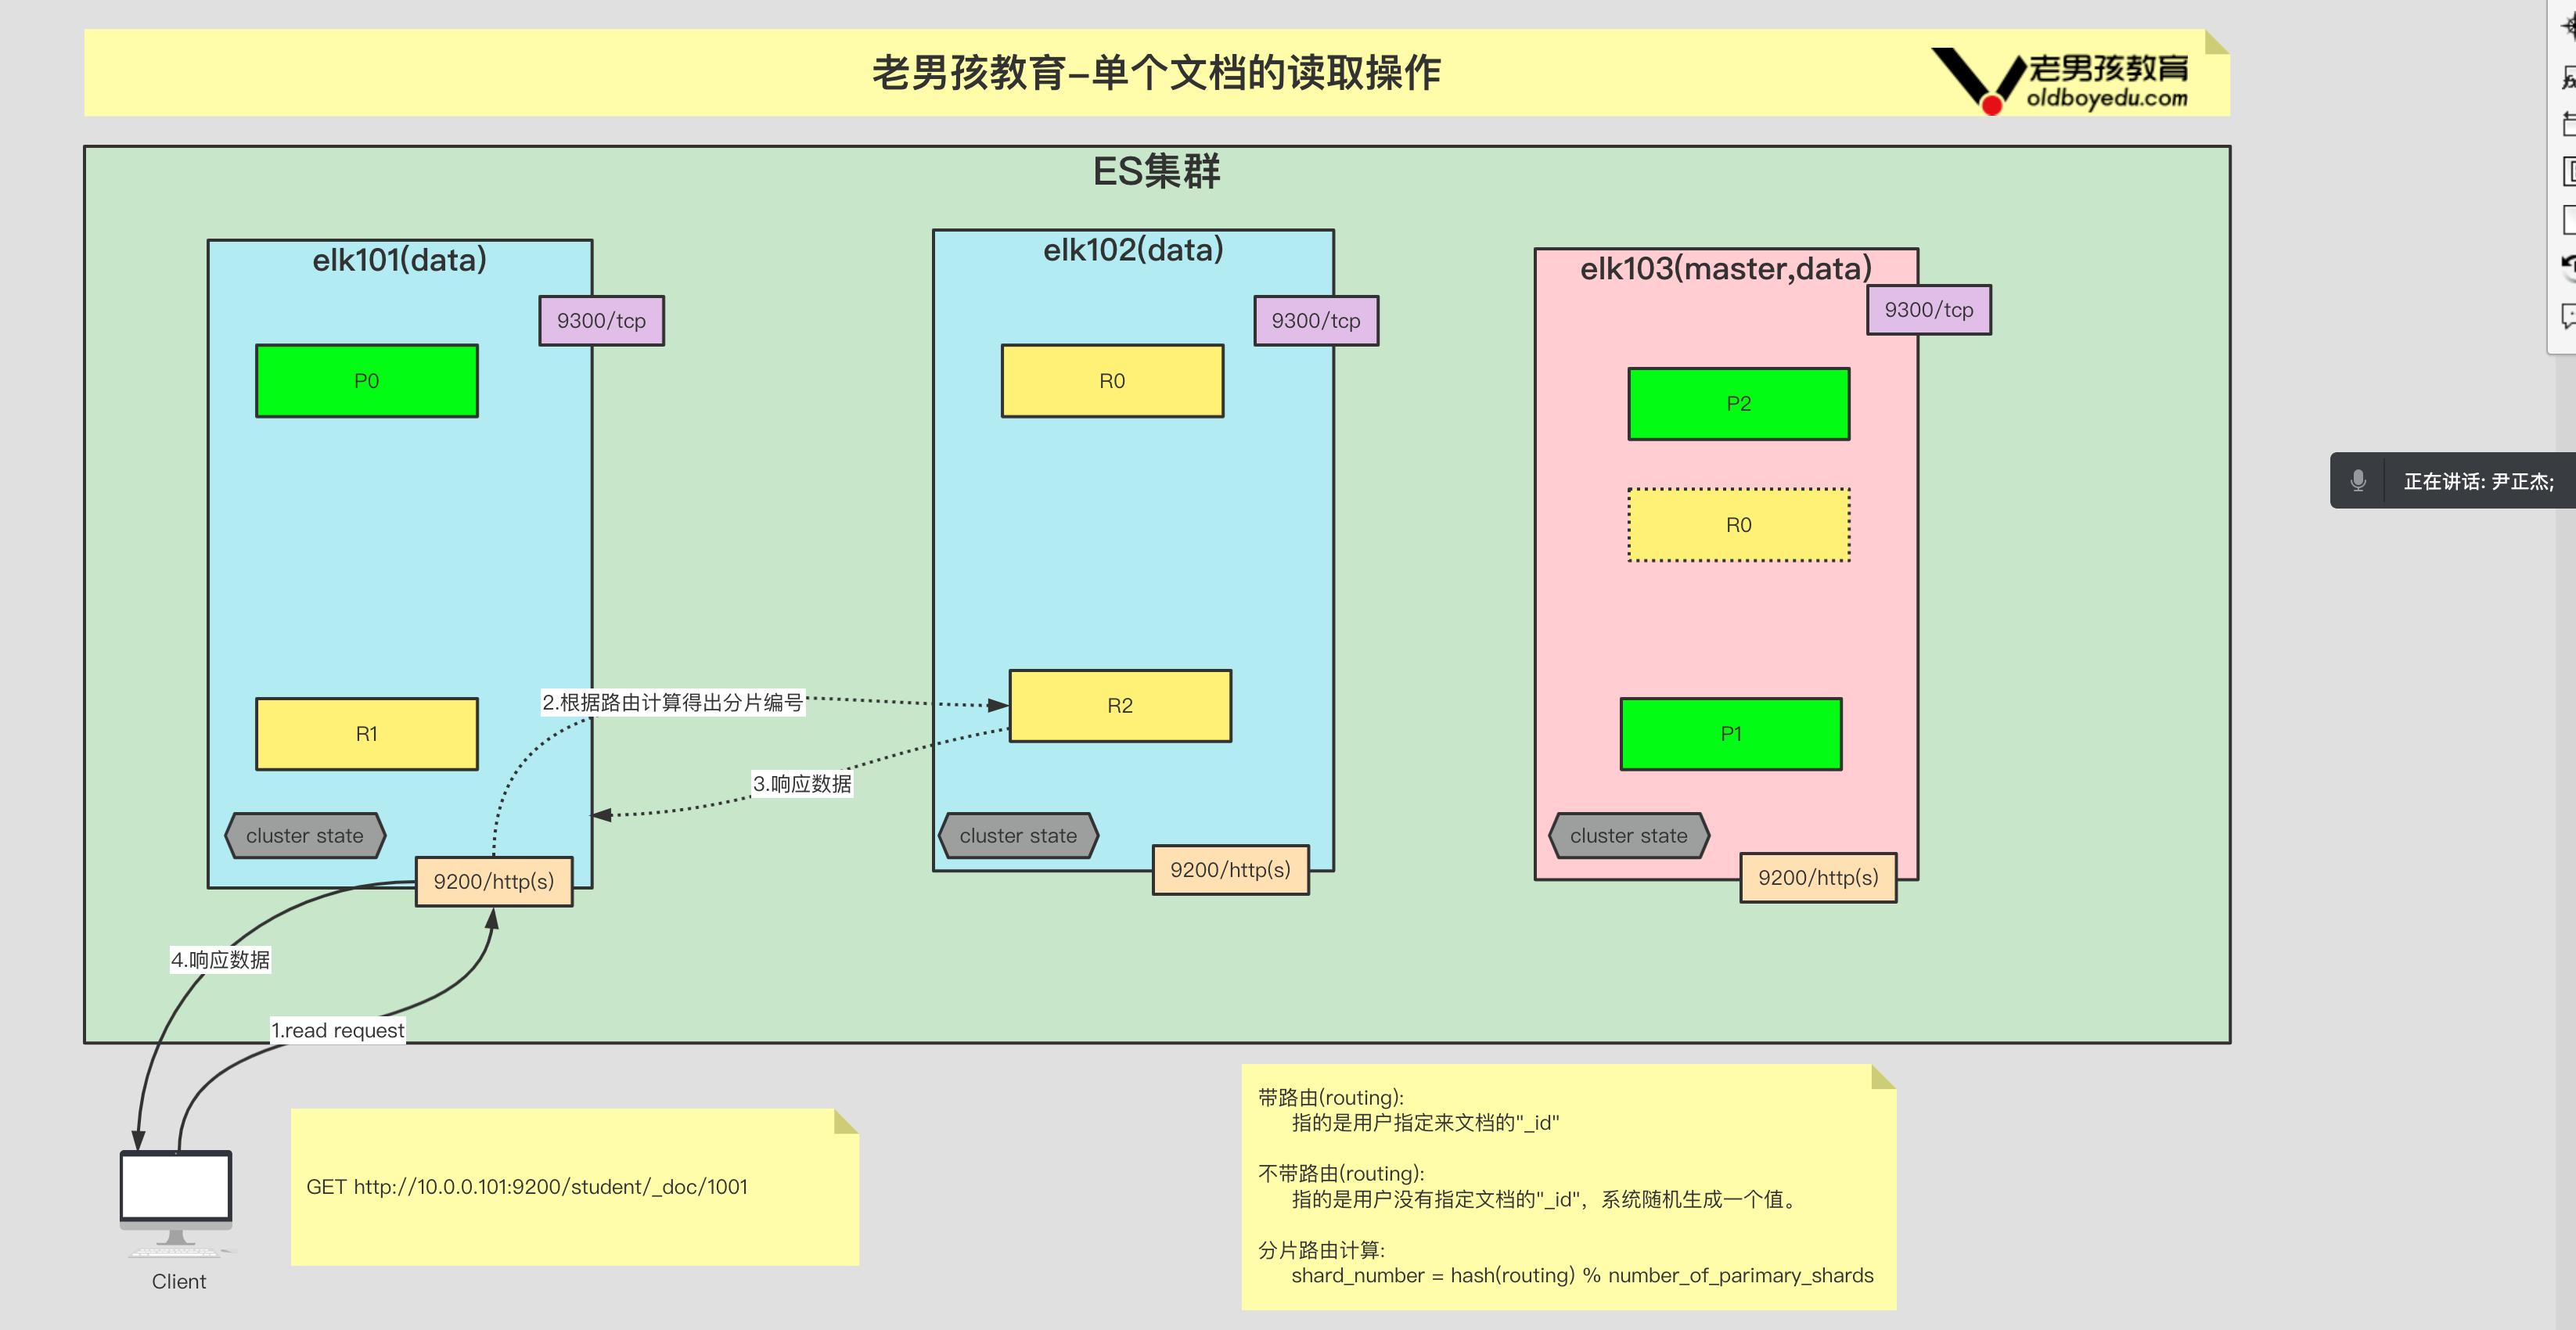
如果 node 需要跨网段通信,Calico 也提供了IPIP模式,IPIP 模式下,calico 会在每个节点上创建一个 tunl0 接口(TUN 类型虚拟设备)用于封装三层隧道报文。节点上每创建一个 Pod 资源,都自动创建一对虚拟以太网接口(TAP 类型的虚拟设备),其中一个附加于 Pod 的网络名称空间,另一个(名称以 cali 为前缀后跟随机字串)留置在节点的根网络名称空间,并经由 tunl0 封装或解封三层隧道报文,Calico IPIP 模式如下图:

IPIP 模式下 calico 的通信过程:

1
2
3
4
5
/ $ traceroute 10.10.58.65  # 请求ip为10.10.58.65的pod
traceroute to 10.10.58.65 (10.10.58.65), 30 hops max, 46 byte packets
1 172.31.6.210 (172.31.6.210) 0.004 ms 0.004 ms 0.002 ms # 当前pod所在node地址
2 10.10.58.64 (10.10.58.64) 0.003 ms 0.432 ms 0.497 ms # 对方pod所在node的tunl0地址
3 10.10.58.65 (10.10.58.65) 0.553 ms 2.114 ms 0.775 ms # 对方pod地址

BGP 模式则直接使用物理机作为虚拟路由路(vRouter),请求直接通过路由跳转,不再创建额外的 tunnel,没有 tunnel 封装、解封的步骤,所以 BGP 的性能会比 IPIP 高很多,建议禁用 IPIP

Service 与 Pod 通信

集群外部与 Service 通信

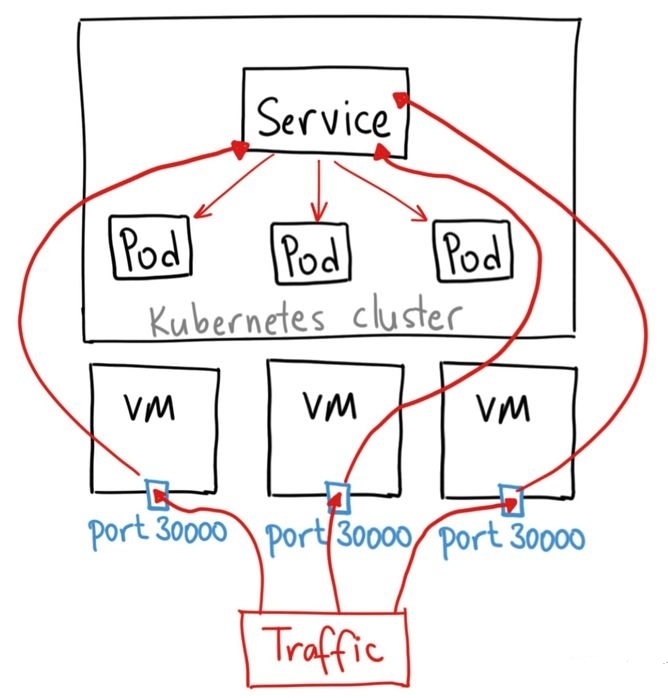
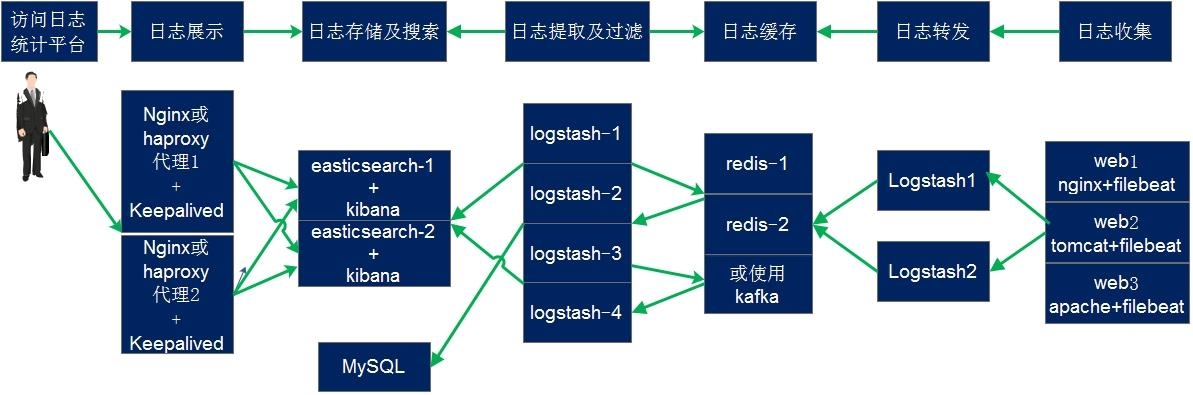
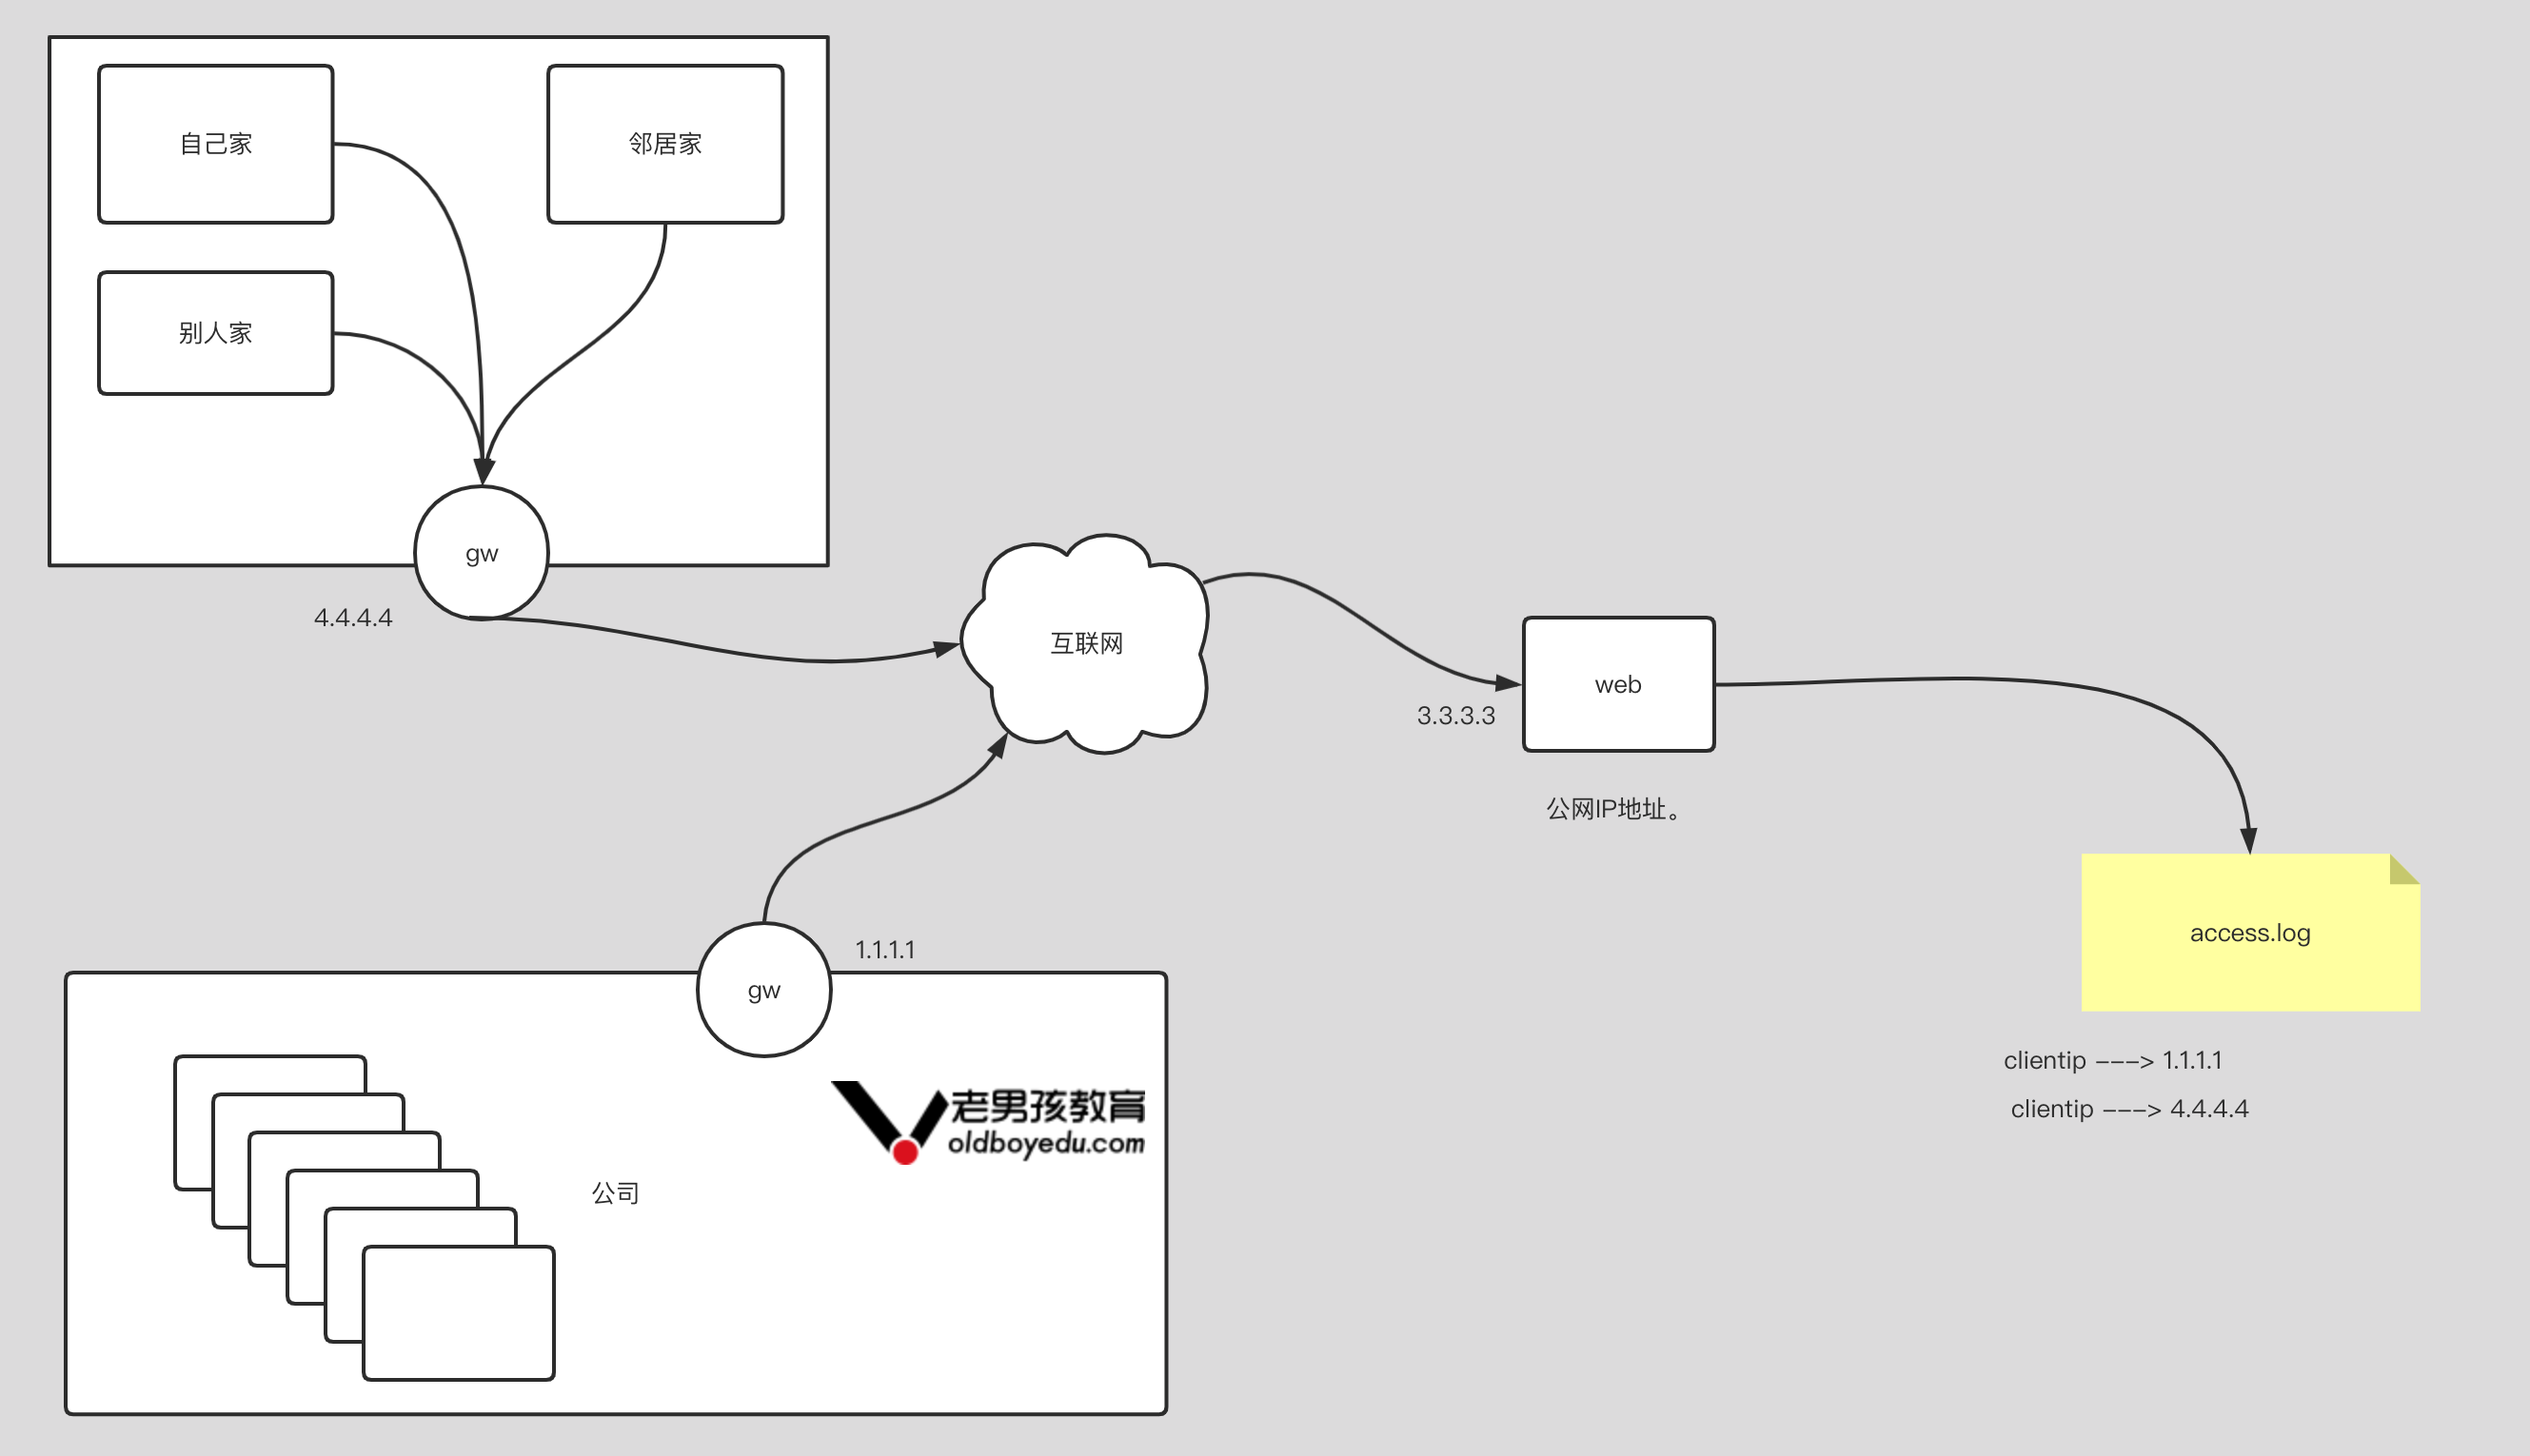
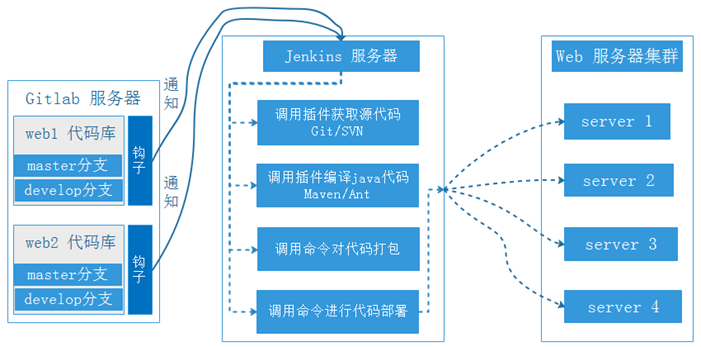
请求流量首先到达外部负载均衡器,由其调度至某个工作节点之上,而后再由工作节点的 netfilter(kube-proxy)组件上的规则(iptables 或 ipvs)调度至某个目标 Pod 对象

集群外的流量先进入节点网络,再进入service 网络,最后进入pod 网络

网络策略

网络策略(Network Policy)是用于控制分组的 Pod 资源彼此之间如何进行通信,以及分组的 Pod 资源如何与其他网络端点进行通信的规范。它用于为 Kubernetes 实现更为精细的流量控制,实现租户隔离机制。Kubernetes 使用标准的资源对象“NetworkPolicy”供管理员按需定义网络访问控制策略

Kubernetes 的网络策略功能由其所使用的网络插件实现,Calico、Canal 及 kube-router 支持网络策略,而 flannel 不支持

etcdctl is a command line client for etcd.

The v3 API is used by default on master branch. For the v2 API, make sure to set environment variable ETCDCTL_API=2. See also READMEv2.

If using released versions earlier than v3.4, set ETCDCTL_API=3 to use v3 API.

Global flags (e.g., dial-timeout, --cacert, --cert, --key) can be set with environment variables:

1
2
3
4
ETCDCTL_DIAL_TIMEOUT=3s
ETCDCTL_CACERT=/tmp/ca.pem
ETCDCTL_CERT=/tmp/cert.pem
ETCDCTL_KEY=/tmp/key.pem

Prefix flag strings with ETCDCTL_, convert all letters to upper-case, and replace dash(-) with underscore(_). Note that the environment variables with the prefix ETCDCTL_ can only be used with the etcdctl global flags. Also, the environment variable ETCDCTL_API is a special case variable for etcdctl internal use only.

Key-value commands

PUT [options] <key> <value>

PUT assigns the specified value with the specified key. If key already holds a value, it is overwritten.

RPC: Put

Options

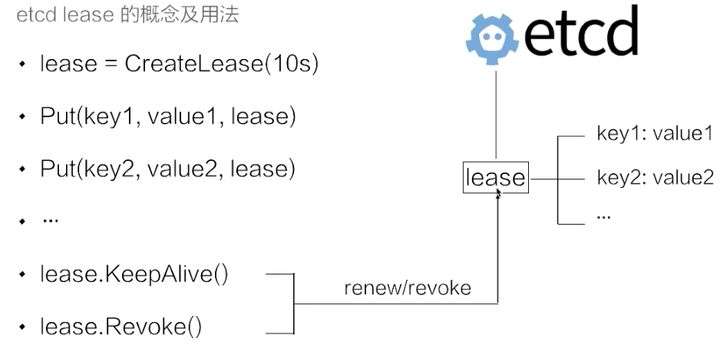
  • lease – lease ID (in hexadecimal) to attach to the key.

  • prev-kv – return the previous key-value pair before modification.

  • ignore-value – updates the key using its current value.

  • ignore-lease – updates the key using its current lease.

Output

OK

Examples

1
2
3
4
5
6
7
./etcdctl put foo bar --lease=1234abcd
# OK
./etcdctl get foo
# foo
# bar
./etcdctl put foo --ignore-value # to detache lease
# OK
1
2
3
4
5
6
7
./etcdctl put foo bar --lease=1234abcd
# OK
./etcdctl put foo bar1 --ignore-lease # to use existing lease 1234abcd
# OK
./etcdctl get foo
# foo
# bar1
1
2
3
4
5
6
7
./etcdctl put foo bar1 --prev-kv
# OK
# foo
# bar
./etcdctl get foo
# foo
# bar1

Remarks

If <value> isn’t given as command line argument, this command tries to read the value from standard input.

When <value> begins with ‘-‘, <value> is interpreted as a flag.
Insert ‘–’ for workaround:

1
2
./etcdctl put <key> -- <value>
./etcdctl put -- <key> <value>

Providing <value> in a new line after using carriage return is not supported and etcdctl may hang in that case. For example, following case is not supported:

1
2
./etcdctl put <key>\r
<value>

A <value> can have multiple lines or spaces but it must be provided with a double-quote as demonstrated below:

1
./etcdctl put foo "bar1 2 3"

GET [options] <key> [range_end]

GET gets the key or a range of keys [key, range_end) if range_end is given.

RPC: Range

Options

  • hex – print out key and value as hex encode string

  • limit – maximum number of results

  • prefix – get keys by matching prefix

  • order – order of results; ASCEND or DESCEND

  • sort-by – sort target; CREATE, KEY, MODIFY, VALUE, or VERSION

  • rev – specify the kv revision

  • print-value-only – print only value when used with write-out=simple

  • consistency – Linearizable(l) or Serializable(s)

  • from-key – Get keys that are greater than or equal to the given key using byte compare

  • keys-only – Get only the keys

Output

<key>\n<value>\n<next_key>\n<next_value>…

Examples

First, populate etcd with some keys:

1
2
3
4
5
6
7
8
./etcdctl put foo bar
# OK
./etcdctl put foo1 bar1
# OK
./etcdctl put foo2 bar2
# OK
./etcdctl put foo3 bar3
# OK

Get the key named foo:

1
2
3
./etcdctl get foo
# foo
# bar

Get all keys:

1
2
3
4
5
6
7
8
9
./etcdctl get --from-key ''
# foo
# bar
# foo1
# bar1
# foo2
# foo2
# foo3
# bar3

Get all keys with names greater than or equal to foo1:

1
2
3
4
5
6
7
./etcdctl get --from-key foo1
# foo1
# bar1
# foo2
# bar2
# foo3
# bar3

Get keys with names greater than or equal to foo1 and less than foo3:

1
2
3
4
5
./etcdctl get foo1 foo3
# foo1
# bar1
# foo2
# bar2

Remarks

If any key or value contains non-printable characters or control characters, simple formatted output can be ambiguous due to new lines. To resolve this issue, set --hex to hex encode all strings.

DEL [options] <key> [range_end]

Removes the specified key or range of keys [key, range_end) if range_end is given.

RPC: DeleteRange

Options

  • prefix – delete keys by matching prefix

  • prev-kv – return deleted key-value pairs

  • from-key – delete keys that are greater than or equal to the given key using byte compare

Output

Prints the number of keys that were removed in decimal if DEL succeeded.

Examples

1
2
3
4
5
./etcdctl put foo bar
# OK
./etcdctl del foo
# 1
./etcdctl get foo
1
2
3
4
5
6
7
./etcdctl put key val
# OK
./etcdctl del --prev-kv key
# 1
# key
# val
./etcdctl get key
1
2
3
4
5
6
7
8
9
./etcdctl put a 123
# OK
./etcdctl put b 456
# OK
./etcdctl put z 789
# OK
./etcdctl del --from-key a
# 3
./etcdctl get --from-key a
1
2
3
4
5
6
7
8
9
./etcdctl put zoo val
# OK
./etcdctl put zoo1 val1
# OK
./etcdctl put zoo2 val2
# OK
./etcdctl del --prefix zoo
# 3
./etcdctl get zoo2

TXN [options]

TXN reads multiple etcd requests from standard input and applies them as a single atomic transaction.
A transaction consists of list of conditions, a list of requests to apply if all the conditions are true, and a list of requests to apply if any condition is false.

RPC: Txn

Options

  • hex – print out keys and values as hex encoded strings.

  • interactive – input transaction with interactive prompting.

Input Format

1
2
3
4
5
6
7
8
9
10
11
12
13
14
15
16
<Txn> ::= <CMP>* "\n" <THEN> "\n" <ELSE> "\n"
<CMP> ::= (<CMPCREATE>|<CMPMOD>|<CMPVAL>|<CMPVER>|<CMPLEASE>) "\n"
<CMPOP> ::= "<" | "=" | ">"
<CMPCREATE> := ("c"|"create")"("<KEY>")" <CMPOP> <REVISION>
<CMPMOD> ::= ("m"|"mod")"("<KEY>")" <CMPOP> <REVISION>
<CMPVAL> ::= ("val"|"value")"("<KEY>")" <CMPOP> <VALUE>
<CMPVER> ::= ("ver"|"version")"("<KEY>")" <CMPOP> <VERSION>
<CMPLEASE> ::= "lease("<KEY>")" <CMPOP> <LEASE>
<THEN> ::= <OP>*
<ELSE> ::= <OP>*
<OP> ::= ((see put, get, del etcdctl command syntax)) "\n"
<KEY> ::= (%q formatted string)
<VALUE> ::= (%q formatted string)
<REVISION> ::= "\""[0-9]+"\""
<VERSION> ::= "\""[0-9]+"\""
<LEASE> ::= "\""[0-9]+\""

Output

SUCCESS if etcd processed the transaction success list, FAILURE if etcd processed the transaction failure list. Prints the output for each command in the executed request list, each separated by a blank line.

Examples

txn in interactive mode:

1
2
3
4
5
6
7
8
9
10
11
12
13
14
15
16
./etcdctl txn -i
# compares:
mod("key1") > "0"

# success requests (get, put, delete):
put key1 "overwrote-key1"

# failure requests (get, put, delete):
put key1 "created-key1"
put key2 "some extra key"

# FAILURE

# OK

# OK

txn in non-interactive mode:

1
2
3
4
5
6
7
8
9
10
11
12
13
14
./etcdctl txn <<<'mod("key1") > "0"

put key1 "overwrote-key1"

put key1 "created-key1"
put key2 "some extra key"

'

# FAILURE

# OK

# OK

Remarks

When using multi-line values within a TXN command, newlines must be represented as \n. Literal newlines will cause parsing failures. This differs from other commands (such as PUT) where the shell will convert literal newlines for us. For example:

1
2
3
4
5
6
7
8
9
10
11
12
13
14
./etcdctl txn <<<'mod("key1") > "0"

put key1 "overwrote-key1"

put key1 "created-key1"
put key2 "this is\na multi-line\nvalue"

'

# FAILURE

# OK

# OK

COMPACTION [options] <revision>

COMPACTION discards all etcd event history prior to a given revision. Since etcd uses a multiversion concurrency control
model, it preserves all key updates as event history. When the event history up to some revision is no longer needed,
all superseded keys may be compacted away to reclaim storage space in the etcd backend database.

RPC: Compact

Options

  • physical – ‘true’ to wait for compaction to physically remove all old revisions

Output

Prints the compacted revision.

Example

1
2
./etcdctl compaction 1234
# compacted revision 1234

WATCH [options] [key or prefix] [range_end] [–] [exec-command arg1 arg2 …]

Watch watches events stream on keys or prefixes, [key or prefix, range_end) if range_end is given. The watch command runs until it encounters an error or is terminated by the user. If range_end is given, it must be lexicographically greater than key or “\x00”.

RPC: Watch

Options

  • hex – print out key and value as hex encode string

  • interactive – begins an interactive watch session

  • prefix – watch on a prefix if prefix is set.

  • prev-kv – get the previous key-value pair before the event happens.

  • rev – the revision to start watching. Specifying a revision is useful for observing past events.

Input format

Input is only accepted for interactive mode.

1
watch [options] <key or prefix>\n

Output

<event>[\n<old_key>\n<old_value>]\n<key>\n<value>\n<event>\n<next_key>\n<next_value>\n…

Examples

Non-interactive
1
2
3
4
./etcdctl watch foo
# PUT
# foo
# bar
1
2
3
4
ETCDCTL_WATCH_KEY=foo ./etcdctl watch
# PUT
# foo
# bar

Receive events and execute echo watch event received:

1
2
3
4
5
./etcdctl watch foo -- echo watch event received
# PUT
# foo
# bar
# watch event received

Watch response is set via ETCD_WATCH_* environmental variables:

1
2
3
4
5
6
7
8
9
./etcdctl watch foo -- sh -c "env | grep ETCD_WATCH_"

# PUT
# foo
# bar
# ETCD_WATCH_REVISION=11
# ETCD_WATCH_KEY="foo"
# ETCD_WATCH_EVENT_TYPE="PUT"
# ETCD_WATCH_VALUE="bar"

Watch with environmental variables and execute echo watch event received:

1
2
3
4
5
6
export ETCDCTL_WATCH_KEY=foo
./etcdctl watch -- echo watch event received
# PUT
# foo
# bar
# watch event received
1
2
3
4
5
6
7
export ETCDCTL_WATCH_KEY=foo
export ETCDCTL_WATCH_RANGE_END=foox
./etcdctl watch -- echo watch event received
# PUT
# fob
# bar
# watch event received
Interactive
1
2
3
4
5
6
7
8
9
./etcdctl watch -i
watch foo
watch foo
# PUT
# foo
# bar
# PUT
# foo
# bar

Receive events and execute echo watch event received:

1
2
3
4
5
6
./etcdctl watch -i
watch foo -- echo watch event received
# PUT
# foo
# bar
# watch event received

Watch with environmental variables and execute echo watch event received:

1
2
3
4
5
6
7
export ETCDCTL_WATCH_KEY=foo
./etcdctl watch -i
watch -- echo watch event received
# PUT
# foo
# bar
# watch event received
1
2
3
4
5
6
7
8
export ETCDCTL_WATCH_KEY=foo
export ETCDCTL_WATCH_RANGE_END=foox
./etcdctl watch -i
watch -- echo watch event received
# PUT
# fob
# bar
# watch event received

LEASE <subcommand>

LEASE provides commands for key lease management.

LEASE GRANT <ttl>

LEASE GRANT creates a fresh lease with a server-selected time-to-live in seconds
greater than or equal to the requested TTL value.

RPC: LeaseGrant

Output

Prints a message with the granted lease ID.

Example

1
2
./etcdctl lease grant 60
# lease 32695410dcc0ca06 granted with TTL(60s)

LEASE REVOKE <leaseID>

LEASE REVOKE destroys a given lease, deleting all attached keys.

RPC: LeaseRevoke

Output

Prints a message indicating the lease is revoked.

Example

1
2
./etcdctl lease revoke 32695410dcc0ca06
# lease 32695410dcc0ca06 revoked

LEASE TIMETOLIVE <leaseID> [options]

LEASE TIMETOLIVE retrieves the lease information with the given lease ID.

RPC: LeaseTimeToLive

Options

  • keys – Get keys attached to this lease

Output

Prints lease information.

Example

1
2
3
4
5
6
7
8
9
10
11
12
13
14
15
16
17
18
19
20
21
22
23
./etcdctl lease grant 500
# lease 2d8257079fa1bc0c granted with TTL(500s)

./etcdctl put foo1 bar --lease=2d8257079fa1bc0c
# OK

./etcdctl put foo2 bar --lease=2d8257079fa1bc0c
# OK

./etcdctl lease timetolive 2d8257079fa1bc0c
# lease 2d8257079fa1bc0c granted with TTL(500s), remaining(481s)

./etcdctl lease timetolive 2d8257079fa1bc0c --keys
# lease 2d8257079fa1bc0c granted with TTL(500s), remaining(472s), attached keys([foo2 foo1])

./etcdctl lease timetolive 2d8257079fa1bc0c --write-out=json
# {"cluster_id":17186838941855831277,"member_id":4845372305070271874,"revision":3,"raft_term":2,"id":3279279168933706764,"ttl":465,"granted-ttl":500,"keys":null}

./etcdctl lease timetolive 2d8257079fa1bc0c --write-out=json --keys
# {"cluster_id":17186838941855831277,"member_id":4845372305070271874,"revision":3,"raft_term":2,"id":3279279168933706764,"ttl":459,"granted-ttl":500,"keys":["Zm9vMQ==","Zm9vMg=="]}

./etcdctl lease timetolive 2d8257079fa1bc0c
# lease 2d8257079fa1bc0c already expired

LEASE LIST

LEASE LIST lists all active leases.

RPC: LeaseLeases

Output

Prints a message with a list of active leases.

Example

1
2
3
4
5
./etcdctl lease grant 60
# lease 32695410dcc0ca06 granted with TTL(60s)

./etcdctl lease list
32695410dcc0ca06

LEASE KEEP-ALIVE <leaseID>

LEASE KEEP-ALIVE periodically refreshes a lease so it does not expire.

RPC: LeaseKeepAlive

Output

Prints a message for every keep alive sent or prints a message indicating the lease is gone.

Example

1
2
3
4
5
./etcdctl lease keep-alive 32695410dcc0ca0
# lease 32695410dcc0ca0 keepalived with TTL(100)
...

Cluster maintenance commands

MEMBER <subcommand>

MEMBER provides commands for managing etcd cluster membership.

MEMBER ADD <memberName> [options]

MEMBER ADD introduces a new member into the etcd cluster as a new peer.

RPC: MemberAdd

Options

  • peer-urls – comma separated list of URLs to associate with the new member.

Output

Prints the member ID of the new member and the cluster ID.

Example

1
2
3
4
5
6
7
./etcdctl member add newMember --peer-urls=https://127.0.0.1:12345

Member ced000fda4d05edf added to cluster 8c4281cc65c7b112

ETCD_NAME="newMember"
ETCD_INITIAL_CLUSTER="newMember=https://127.0.0.1:12345,default=http://10.0.0.30:2380"
ETCD_INITIAL_CLUSTER_STATE="existing"

MEMBER UPDATE <memberID> [options]

MEMBER UPDATE sets the peer URLs for an existing member in the etcd cluster.

RPC: MemberUpdate

Options

  • peer-urls – comma separated list of URLs to associate with the updated member.

Output

Prints the member ID of the updated member and the cluster ID.

Example

1
2
./etcdctl member update 2be1eb8f84b7f63e --peer-urls=https://127.0.0.1:11112
# Member 2be1eb8f84b7f63e updated in cluster ef37ad9dc622a7c4

MEMBER REMOVE <memberID>

MEMBER REMOVE removes a member of an etcd cluster from participating in cluster consensus.

RPC: MemberRemove

Output

Prints the member ID of the removed member and the cluster ID.

Example

1
2
./etcdctl member remove 2be1eb8f84b7f63e
# Member 2be1eb8f84b7f63e removed from cluster ef37ad9dc622a7c4

MEMBER LIST

MEMBER LIST prints the member details for all members associated with an etcd cluster.

RPC: MemberList

Output

Prints a humanized table of the member IDs, statuses, names, peer addresses, and client addresses.

Examples

1
2
3
4
./etcdctl member list
# 8211f1d0f64f3269, started, infra1, http://127.0.0.1:12380, http://127.0.0.1:2379
# 91bc3c398fb3c146, started, infra2, http://127.0.0.1:22380, http://127.0.0.1:22379
# fd422379fda50e48, started, infra3, http://127.0.0.1:32380, http://127.0.0.1:32379
1
2
./etcdctl -w json member list
# {"header":{"cluster_id":17237436991929493444,"member_id":9372538179322589801,"raft_term":2},"members":[{"ID":9372538179322589801,"name":"infra1","peerURLs":["http://127.0.0.1:12380"],"clientURLs":["http://127.0.0.1:2379"]},{"ID":10501334649042878790,"name":"infra2","peerURLs":["http://127.0.0.1:22380"],"clientURLs":["http://127.0.0.1:22379"]},{"ID":18249187646912138824,"name":"infra3","peerURLs":["http://127.0.0.1:32380"],"clientURLs":["http://127.0.0.1:32379"]}]}
1
2
3
4
5
6
7
8
./etcdctl -w table member list
+------------------+---------+--------+------------------------+------------------------+
| ID | STATUS | NAME | PEER ADDRS | CLIENT ADDRS |
+------------------+---------+--------+------------------------+------------------------+
| 8211f1d0f64f3269 | started | infra1 | http://127.0.0.1:12380 | http://127.0.0.1:2379 |
| 91bc3c398fb3c146 | started | infra2 | http://127.0.0.1:22380 | http://127.0.0.1:22379 |
| fd422379fda50e48 | started | infra3 | http://127.0.0.1:32380 | http://127.0.0.1:32379 |
+------------------+---------+--------+------------------------+------------------------+

ENDPOINT <subcommand>

ENDPOINT provides commands for querying individual endpoints.

Options

  • cluster – fetch and use all endpoints from the etcd cluster member list

ENDPOINT HEALTH

ENDPOINT HEALTH checks the health of the list of endpoints with respect to cluster. An endpoint is unhealthy
when it cannot participate in consensus with the rest of the cluster.

Output

If an endpoint can participate in consensus, prints a message indicating the endpoint is healthy. If an endpoint fails to participate in consensus, prints a message indicating the endpoint is unhealthy.

Example

Check the default endpoint’s health:

1
2
./etcdctl endpoint health
# 127.0.0.1:2379 is healthy: successfully committed proposal: took = 2.095242ms

Check all endpoints for the cluster associated with the default endpoint:

1
2
3
4
./etcdctl endpoint --cluster health
# http://127.0.0.1:2379 is healthy: successfully committed proposal: took = 1.060091ms
# http://127.0.0.1:22379 is healthy: successfully committed proposal: took = 903.138µs
# http://127.0.0.1:32379 is healthy: successfully committed proposal: took = 1.113848ms

ENDPOINT STATUS

ENDPOINT STATUS queries the status of each endpoint in the given endpoint list.

Output

Simple format

Prints a humanized table of each endpoint URL, ID, version, database size, leadership status, raft term, and raft status.

JSON format

Prints a line of JSON encoding each endpoint URL, ID, version, database size, leadership status, raft term, and raft status.

Examples

Get the status for the default endpoint:

1
2
./etcdctl endpoint status
# 127.0.0.1:2379, 8211f1d0f64f3269, 3.0.0, 25 kB, false, 2, 63

Get the status for the default endpoint as JSON:

1
2
./etcdctl -w json endpoint status
# [{"Endpoint":"127.0.0.1:2379","Status":{"header":{"cluster_id":17237436991929493444,"member_id":9372538179322589801,"revision":2,"raft_term":2},"version":"3.0.0","dbSize":24576,"leader":18249187646912138824,"raftIndex":32623,"raftTerm":2}}]

Get the status for all endpoints in the cluster associated with the default endpoint:

1
2
3
4
5
6
7
8
./etcdctl -w table endpoint --cluster status
+------------------------+------------------+----------------+---------+-----------+-----------+------------+
| ENDPOINT | ID | VERSION | DB SIZE | IS LEADER | RAFT TERM | RAFT INDEX |
+------------------------+------------------+----------------+---------+-----------+-----------+------------+
| http://127.0.0.1:2379 | 8211f1d0f64f3269 | 3.2.0-rc.1+git | 25 kB | false | 2 | 8 |
| http://127.0.0.1:22379 | 91bc3c398fb3c146 | 3.2.0-rc.1+git | 25 kB | false | 2 | 8 |
| http://127.0.0.1:32379 | fd422379fda50e48 | 3.2.0-rc.1+git | 25 kB | true | 2 | 8 |
+------------------------+------------------+----------------+---------+-----------+-----------+------------+

ENDPOINT HASHKV

ENDPOINT HASHKV fetches the hash of the key-value store of an endpoint.

Output

Simple format

Prints a humanized table of each endpoint URL and KV history hash.

JSON format

Prints a line of JSON encoding each endpoint URL and KV history hash.

Examples

Get the hash for the default endpoint:

1
2
./etcdctl endpoint hashkv
# 127.0.0.1:2379, 1084519789

Get the status for the default endpoint as JSON:

1
2
./etcdctl -w json endpoint hashkv
# [{"Endpoint":"127.0.0.1:2379","Hash":{"header":{"cluster_id":14841639068965178418,"member_id":10276657743932975437,"revision":1,"raft_term":3},"hash":1084519789,"compact_revision":-1}}]

Get the status for all endpoints in the cluster associated with the default endpoint:

1
2
3
4
5
6
7
8
./etcdctl -w table endpoint --cluster hashkv
+------------------------+------------+
| ENDPOINT | HASH |
+------------------------+------------+
| http://127.0.0.1:2379 | 1084519789 |
| http://127.0.0.1:22379 | 1084519789 |
| http://127.0.0.1:32379 | 1084519789 |
+------------------------+------------+

ALARM <subcommand>

Provides alarm related commands

ALARM DISARM

alarm disarm Disarms all alarms

RPC: Alarm

Output

alarm:<alarm type> if alarm is present and disarmed.

Examples

1
./etcdctl alarm disarm

If NOSPACE alarm is present:

1
2
./etcdctl alarm disarm
# alarm:NOSPACE

ALARM LIST

alarm list lists all alarms.

RPC: Alarm

Output

alarm:<alarm type> if alarm is present, empty string if no alarms present.

Examples

1
./etcdctl alarm list

If NOSPACE alarm is present:

1
2
./etcdctl alarm list
# alarm:NOSPACE

DEFRAG [options]

DEFRAG defragments the backend database file for a set of given endpoints while etcd is running, or directly defragments an etcd data directory while etcd is not running. When an etcd member reclaims storage space from deleted and compacted keys, the space is kept in a free list and the database file remains the same size. By defragmenting the database, the etcd member releases this free space back to the file system.

Note that defragmentation to a live member blocks the system from reading and writing data while rebuilding its states.

Note that defragmentation request does not get replicated over cluster. That is, the request is only applied to the local node. Specify all members in --endpoints flag or --cluster flag to automatically find all cluster members.

Options

  • data-dir – Optional. If present, defragments a data directory not in use by etcd.

Output

For each endpoints, prints a message indicating whether the endpoint was successfully defragmented.

Example

1
2
3
./etcdctl --endpoints=localhost:2379,badendpoint:2379 defrag
# Finished defragmenting etcd member[localhost:2379]
# Failed to defragment etcd member[badendpoint:2379] (grpc: timed out trying to connect)

Run defragment operations for all endpoints in the cluster associated with the default endpoint:

1
2
3
4
./etcdctl defrag --cluster
Finished defragmenting etcd member[http://127.0.0.1:2379]
Finished defragmenting etcd member[http://127.0.0.1:22379]
Finished defragmenting etcd member[http://127.0.0.1:32379]

To defragment a data directory directly, use the --data-dir flag:

1
2
3
4
# Defragment while etcd is not running
./etcdctl defrag --data-dir default.etcd
# success (exit status 0)
# Error: cannot open database at default.etcd/member/snap/db

Remarks

DEFRAG returns a zero exit code only if it succeeded defragmenting all given endpoints.

SNAPSHOT <subcommand>

SNAPSHOT provides commands to restore a snapshot of a running etcd server into a fresh cluster.

SNAPSHOT SAVE <filename>

SNAPSHOT SAVE writes a point-in-time snapshot of the etcd backend database to a file.

Output

The backend snapshot is written to the given file path.

Example

Save a snapshot to “snapshot.db”:

1
./etcdctl snapshot save snapshot.db

SNAPSHOT RESTORE [options] <filename>

SNAPSHOT RESTORE creates an etcd data directory for an etcd cluster member from a backend database snapshot and a new cluster configuration. Restoring the snapshot into each member for a new cluster configuration will initialize a new etcd cluster preloaded by the snapshot data.

Options

The snapshot restore options closely resemble to those used in the etcd command for defining a cluster.

  • data-dir – Path to the data directory. Uses <name>.etcd if none given.

  • wal-dir – Path to the WAL directory. Uses data directory if none given.

  • initial-cluster – The initial cluster configuration for the restored etcd cluster.

  • initial-cluster-token – Initial cluster token for the restored etcd cluster.

  • initial-advertise-peer-urls – List of peer URLs for the member being restored.

  • name – Human-readable name for the etcd cluster member being restored.

  • skip-hash-check – Ignore snapshot integrity hash value (required if copied from data directory)

Output

A new etcd data directory initialized with the snapshot.

Example

Save a snapshot, restore into a new 3 node cluster, and start the cluster:

1
2
3
4
5
6
7
8
9
10
11
./etcdctl snapshot save snapshot.db

# restore members
bin/etcdctl snapshot restore snapshot.db --initial-cluster-token etcd-cluster-1 --initial-advertise-peer-urls http://127.0.0.1:12380 --name sshot1 --initial-cluster 'sshot1=http://127.0.0.1:12380,sshot2=http://127.0.0.1:22380,sshot3=http://127.0.0.1:32380'
bin/etcdctl snapshot restore snapshot.db --initial-cluster-token etcd-cluster-1 --initial-advertise-peer-urls http://127.0.0.1:22380 --name sshot2 --initial-cluster 'sshot1=http://127.0.0.1:12380,sshot2=http://127.0.0.1:22380,sshot3=http://127.0.0.1:32380'
bin/etcdctl snapshot restore snapshot.db --initial-cluster-token etcd-cluster-1 --initial-advertise-peer-urls http://127.0.0.1:32380 --name sshot3 --initial-cluster 'sshot1=http://127.0.0.1:12380,sshot2=http://127.0.0.1:22380,sshot3=http://127.0.0.1:32380'

# launch members
bin/etcd --name sshot1 --listen-client-urls http://127.0.0.1:2379 --advertise-client-urls http://127.0.0.1:2379 --listen-peer-urls http://127.0.0.1:12380 &
bin/etcd --name sshot2 --listen-client-urls http://127.0.0.1:22379 --advertise-client-urls http://127.0.0.1:22379 --listen-peer-urls http://127.0.0.1:22380 &
bin/etcd --name sshot3 --listen-client-urls http://127.0.0.1:32379 --advertise-client-urls http://127.0.0.1:32379 --listen-peer-urls http://127.0.0.1:32380 &

SNAPSHOT STATUS <filename>

SNAPSHOT STATUS lists information about a given backend database snapshot file.

Output

Simple format

Prints a humanized table of the database hash, revision, total keys, and size.

JSON format

Prints a line of JSON encoding the database hash, revision, total keys, and size.

Examples

1
2
./etcdctl snapshot status file.db
# cf1550fb, 3, 3, 25 kB
1
2
./etcdctl -write-out=json snapshot status file.db
# {"hash":3474280699,"revision":3,"totalKey":3,"totalSize":24576}
1
2
3
4
5
6
./etcdctl -write-out=table snapshot status file.db
+----------+----------+------------+------------+
| HASH | REVISION | TOTAL KEYS | TOTAL SIZE |
+----------+----------+------------+------------+
| cf1550fb | 3 | 3 | 25 kB |
+----------+----------+------------+------------+

MOVE-LEADER <hexadecimal-transferee-id>

MOVE-LEADER transfers leadership from the leader to another member in the cluster.

Example

1
2
3
4
5
6
7
8
9
10
11
12
13
14
# to choose transferee
transferee_id=$(./etcdctl \
--endpoints localhost:2379,localhost:22379,localhost:32379 \
endpoint status | grep -m 1 "false" | awk -F', ' '{print $2}')
echo ${transferee_id}
# c89feb932daef420

# endpoints should include leader node
./etcdctl --endpoints ${transferee_ep} move-leader ${transferee_id}
# Error: no leader endpoint given at [localhost:22379 localhost:32379]

# request to leader with target node ID
./etcdctl --endpoints ${leader_ep} move-leader ${transferee_id}
# Leadership transferred from 45ddc0e800e20b93 to c89feb932daef420

Concurrency commands

LOCK [options] <lockname> [command arg1 arg2 …]

LOCK acquires a distributed mutex with a given name. Once the lock is acquired, it will be held until etcdctl is terminated.

Options

  • ttl - time out in seconds of lock session.

Output

Once the lock is acquired but no command is given, the result for the GET on the unique lock holder key is displayed.

If a command is given, it will be executed with environment variables ETCD_LOCK_KEY and ETCD_LOCK_REV set to the lock’s holder key and revision.

Example

Acquire lock with standard output display:

1
2
./etcdctl lock mylock
# mylock/1234534535445

Acquire lock and execute echo lock acquired:

1
2
./etcdctl lock mylock echo lock acquired
# lock acquired

Acquire lock and execute etcdctl put command

1
2
./etcdctl lock mylock ./etcdctl put foo bar
# OK

Remarks

LOCK returns a zero exit code only if it is terminated by a signal and releases the lock.

If LOCK is abnormally terminated or fails to contact the cluster to release the lock, the lock will remain held until the lease expires. Progress may be delayed by up to the default lease length of 60 seconds.

ELECT [options] <election-name> [proposal]

ELECT participates on a named election. A node announces its candidacy in the election by providing
a proposal value. If a node wishes to observe the election, ELECT listens for new leaders values.
Whenever a leader is elected, its proposal is given as output.

Options

  • listen – observe the election.

Output

  • If a candidate, ELECT displays the GET on the leader key once the node is elected election.

  • If observing, ELECT streams the result for a GET on the leader key for the current election and all future elections.

Example

1
2
3
./etcdctl elect myelection foo
# myelection/1456952310051373265
# foo

Remarks

ELECT returns a zero exit code only if it is terminated by a signal and can revoke its candidacy or leadership, if any.

If a candidate is abnormally terminated, election rogress may be delayed by up to the default lease length of 60 seconds.

Authentication commands

AUTH <enable or disable>

auth enable activates authentication on an etcd cluster and auth disable deactivates. When authentication is enabled, etcd checks all requests for appropriate authorization.

RPC: AuthEnable/AuthDisable

Output

Authentication Enabled.

Examples

1
2
3
4
5
6
7
8
9
10
11
12
13
14
15
16
17
./etcdctl user add root
# Password of root:#type password for root
# Type password of root again for confirmation:#re-type password for root
# User root created
./etcdctl user grant-role root root
# Role root is granted to user root
./etcdctl user get root
# User: root
# Roles: root
./etcdctl role add root
# Role root created
./etcdctl role get root
# Role root
# KV Read:
# KV Write:
./etcdctl auth enable
# Authentication Enabled

ROLE <subcommand>

ROLE is used to specify different roles which can be assigned to etcd user(s).

ROLE ADD <role name>

role add creates a role.

RPC: RoleAdd

Output

Role <role name> created.

Examples

1
2
./etcdctl --user=root:123 role add myrole
# Role myrole created

ROLE GET <role name>

role get lists detailed role information.

RPC: RoleGet

Output

Detailed role information.

Examples

1
2
3
4
5
6
./etcdctl --user=root:123 role get myrole
# Role myrole
# KV Read:
# foo
# KV Write:
# foo

ROLE DELETE <role name>

role delete deletes a role.

RPC: RoleDelete

Output

Role <role name> deleted.

Examples

1
2
./etcdctl --user=root:123 role delete myrole
# Role myrole deleted

ROLE LIST <role name>

role list lists all roles in etcd.

RPC: RoleList

Output

A role per line.

Examples

1
2
3
4
./etcdctl --user=root:123 role list
# roleA
# roleB
# myrole

ROLE GRANT-PERMISSION [options] <role name> <permission type> <key> [endkey]

role grant-permission grants a key to a role.

RPC: RoleGrantPermission

Options

  • from-key – grant a permission of keys that are greater than or equal to the given key using byte compare

  • prefix – grant a prefix permission

Output

Role <role name> updated.

Examples

Grant read and write permission on the key foo to role myrole:

1
2
./etcdctl --user=root:123 role grant-permission myrole readwrite foo
# Role myrole updated

Grant read permission on the wildcard key pattern foo/* to role myrole:

1
2
./etcdctl --user=root:123 role grant-permission --prefix myrole readwrite foo/
# Role myrole updated

ROLE REVOKE-PERMISSION <role name> <permission type> <key> [endkey]

role revoke-permission revokes a key from a role.

RPC: RoleRevokePermission

Options

  • from-key – revoke a permission of keys that are greater than or equal to the given key using byte compare

  • prefix – revoke a prefix permission

Output

Permission of key <key> is revoked from role <role name> for single key. Permission of range [<key>, <endkey>) is revoked from role <role name> for a key range. Exit code is zero.

Examples

1
2
./etcdctl --user=root:123 role revoke-permission myrole foo
# Permission of key foo is revoked from role myrole

USER <subcommand>

USER provides commands for managing users of etcd.

USER ADD <user name or user:password> [options]

user add creates a user.

RPC: UserAdd

Options

  • interactive – Read password from stdin instead of interactive terminal

Output

User <user name> created.

Examples

1
2
3
4
./etcdctl --user=root:123 user add myuser
# Password of myuser: #type password for my user
# Type password of myuser again for confirmation:#re-type password for my user
# User myuser created

USER GET <user name> [options]

user get lists detailed user information.

RPC: UserGet

Options

  • detail – Show permissions of roles granted to the user

Output

Detailed user information.

Examples

1
2
3
./etcdctl --user=root:123 user get myuser
# User: myuser
# Roles:

USER DELETE <user name>

user delete deletes a user.

RPC: UserDelete

Output

User <user name> deleted.

Examples

1
2
./etcdctl --user=root:123 user delete myuser
# User myuser deleted

USER LIST

user list lists detailed user information.

RPC: UserList

Output

  • List of users, one per line.

Examples

1
2
3
4
./etcdctl --user=root:123 user list
# user1
# user2
# myuser

USER PASSWD <user name> [options]

user passwd changes a user’s password.

RPC: UserChangePassword

Options

  • interactive – if true, read password in interactive terminal

Output

Password updated.

Examples

1
2
3
4
./etcdctl --user=root:123 user passwd myuser
# Password of myuser: #type new password for my user
# Type password of myuser again for confirmation: #re-type the new password for my user
# Password updated

USER GRANT-ROLE <user name> <role name>

user grant-role grants a role to a user

RPC: UserGrantRole

Output

Role <role name> is granted to user <user name>.

Examples

1
2
./etcdctl --user=root:123 user grant-role userA roleA
# Role roleA is granted to user userA

USER REVOKE-ROLE <user name> <role name>

user revoke-role revokes a role from a user

RPC: UserRevokeRole

Output

Role <role name> is revoked from user <user name>.

Examples

1
2
./etcdctl --user=root:123 user revoke-role userA roleA
# Role roleA is revoked from user userA

Utility commands

MAKE-MIRROR [options] <destination>

make-mirror mirrors a key prefix in an etcd cluster to a destination etcd cluster.

Options

  • dest-cacert – TLS certificate authority file for destination cluster

  • dest-cert – TLS certificate file for destination cluster

  • dest-key – TLS key file for destination cluster

  • prefix – The key-value prefix to mirror

  • dest-prefix – The destination prefix to mirror a prefix to a different prefix in the destination cluster

  • no-dest-prefix – Mirror key-values to the root of the destination cluster

  • dest-insecure-transport – Disable transport security for client connections

Output

The approximate total number of keys transferred to the destination cluster, updated every 30 seconds.

Examples

1
2
3
./etcdctl make-mirror mirror.example.com:2379
# 10
# 18

MIGRATE [options]

Migrates keys in a v2 store to a v3 mvcc store. Users should run migration command for all members in the cluster.

Options

  • data-dir – Path to the data directory

  • wal-dir – Path to the WAL directory

  • transformer – Path to the user-provided transformer program (default if not provided)

Output

No output on success.

Default transformer

If user does not provide a transformer program, migrate command will use the default transformer. The default transformer transforms storev2 formatted keys into mvcc formatted keys according to the following Go program:

1
2
3
4
5
6
7
8
9
10
11
12
13
func transform(n *storev2.Node) *mvccpb.KeyValue {
if n.Dir {
return nil
}
kv := &mvccpb.KeyValue{
Key: []byte(n.Key),
Value: []byte(n.Value),
CreateRevision: int64(n.CreatedIndex),
ModRevision: int64(n.ModifiedIndex),
Version: 1,
}
return kv
}

User-provided transformer

Users can provide a customized 1:n transformer function that transforms a key from the v2 store to any number of keys in the mvcc store. The migration program writes JSON formatted v2 store keys to the transformer program’s stdin, reads protobuf formatted mvcc keys back from the transformer program’s stdout, and finishes migration by saving the transformed keys into the mvcc store.

The provided transformer should read until EOF and flush the stdout before exiting to ensure data integrity.

Example

1
2
./etcdctl migrate --data-dir=/var/etcd --transformer=k8s-transformer
# finished transforming keys

VERSION

Prints the version of etcdctl.

Output

Prints etcd version and API version.

Examples

1
2
3
./etcdctl version
# etcdctl version: 3.1.0-alpha.0+git
# API version: 3.1

CHECK <subcommand>

CHECK provides commands for checking properties of the etcd cluster.

CHECK PERF [options]

CHECK PERF checks the performance of the etcd cluster for 60 seconds. Running the check perf often can create a large keyspace history which can be auto compacted and defragmented using the --auto-compact and --auto-defrag options as described below.

RPC: CheckPerf

Options

  • load – the performance check’s workload model. Accepted workloads: s(small), m(medium), l(large), xl(xLarge)

  • prefix – the prefix for writing the performance check’s keys.

  • auto-compact – if true, compact storage with last revision after test is finished.

  • auto-defrag – if true, defragment storage after test is finished.

Output

Prints the result of performance check on different criteria like throughput. Also prints an overall status of the check as pass or fail.

Examples

Shows examples of both, pass and fail, status. The failure is due to the fact that a large workload was tried on a single node etcd cluster running on a laptop environment created for development and testing purpose.

1
2
3
4
5
6
7
8
9
10
11
12
./etcdctl check perf --load="s"
# 60 / 60 Booooooooooooooooooooooooooooooooooooooooooooooooooooooooooooooooooooooooooooooooo! 100.00%1m0s
# PASS: Throughput is 150 writes/s
# PASS: Slowest request took 0.087509s
# PASS: Stddev is 0.011084s
# PASS
./etcdctl check perf --load="l"
# 60 / 60 Booooooooooooooooooooooooooooooooooooooooooooooooooooooooooooooooooooooooooooooooo! 100.00%1m0s
# FAIL: Throughput too low: 6808 writes/s
# PASS: Slowest request took 0.228191s
# PASS: Stddev is 0.033547s
# FAIL

CHECK DATASCALE [options]

CHECK DATASCALE checks the memory usage of holding data for different workloads on a given server endpoint. Running the check datascale often can create a large keyspace history which can be auto compacted and defragmented using the --auto-compact and --auto-defrag options as described below.

RPC: CheckDatascale

Options

  • load – the datascale check’s workload model. Accepted workloads: s(small), m(medium), l(large), xl(xLarge)

  • prefix – the prefix for writing the datascale check’s keys.

  • auto-compact – if true, compact storage with last revision after test is finished.

  • auto-defrag – if true, defragment storage after test is finished.

Output

Prints the system memory usage for a given workload. Also prints status of compact and defragment if related options are passed.

Examples

1
2
3
4
5
6
7
./etcdctl check datascale --load="s" --auto-compact=true --auto-defrag=true
# Start data scale check for work load [10000 key-value pairs, 1024 bytes per key-value, 50 concurrent clients].
# Compacting with revision 18346204
# Compacted with revision 18346204
# Defragmenting "127.0.0.1:2379"
# Defragmented "127.0.0.1:2379"
# PASS: Approximate system memory used : 64.30 MB.

Exit codes

For all commands, a successful execution return a zero exit code. All failures will return non-zero exit codes.

Output formats

All commands accept an output format by setting -w or --write-out. All commands default to the “simple” output format, which is meant to be human-readable. The simple format is listed in each command’s Output description since it is customized for each command. If a command has a corresponding RPC, it will respect all output formats.

If a command fails, returning a non-zero exit code, an error string will be written to standard error regardless of output format.

Simple

A format meant to be easy to parse and human-readable. Specific to each command.

JSON

The JSON encoding of the command’s RPC response. Since etcd’s RPCs use byte strings, the JSON output will encode keys and values in base64.

Some commands without an RPC also support JSON; see the command’s Output description.

Protobuf

The protobuf encoding of the command’s RPC response. If an RPC is streaming, the stream messages will be concetenated. If an RPC is not given for a command, the protobuf output is not defined.

Fields

An output format similar to JSON but meant to parse with coreutils. For an integer field named Field, it writes a line in the format "Field" : %d where %d is go’s integer formatting. For byte array fields, it writes "Field" : %q where %q is go’s quoted string formatting (e.g., []byte{'a', '\n'} is written as "a\n").

Compatibility Support

etcdctl is still in its early stage. We try out best to ensure fully compatible releases, however we might break compatibility to fix bugs or improve commands. If we intend to release a version of etcdctl with backward incompatibilities, we will provide notice prior to release and have instructions on how to upgrade.

Input Compatibility

Input includes the command name, its flags, and its arguments. We ensure backward compatibility of the input of normal commands in non-interactive mode.

Output Compatibility

Output includes output from etcdctl and its exit code. etcdctl provides simple output format by default.
We ensure compatibility for the simple output format of normal commands in non-interactive mode. Currently, we do not ensure
backward compatibility for JSON format and the format in non-interactive mode. Currently, we do not ensure backward compatibility of utility commands.

TODO: compatibility with etcd server

service

参考:https://www.cnblogs.com/fuyuteng/p/11598768.html
kubernetes service 原理解析 - 知乎 (zhihu.com)

为什么需要 service

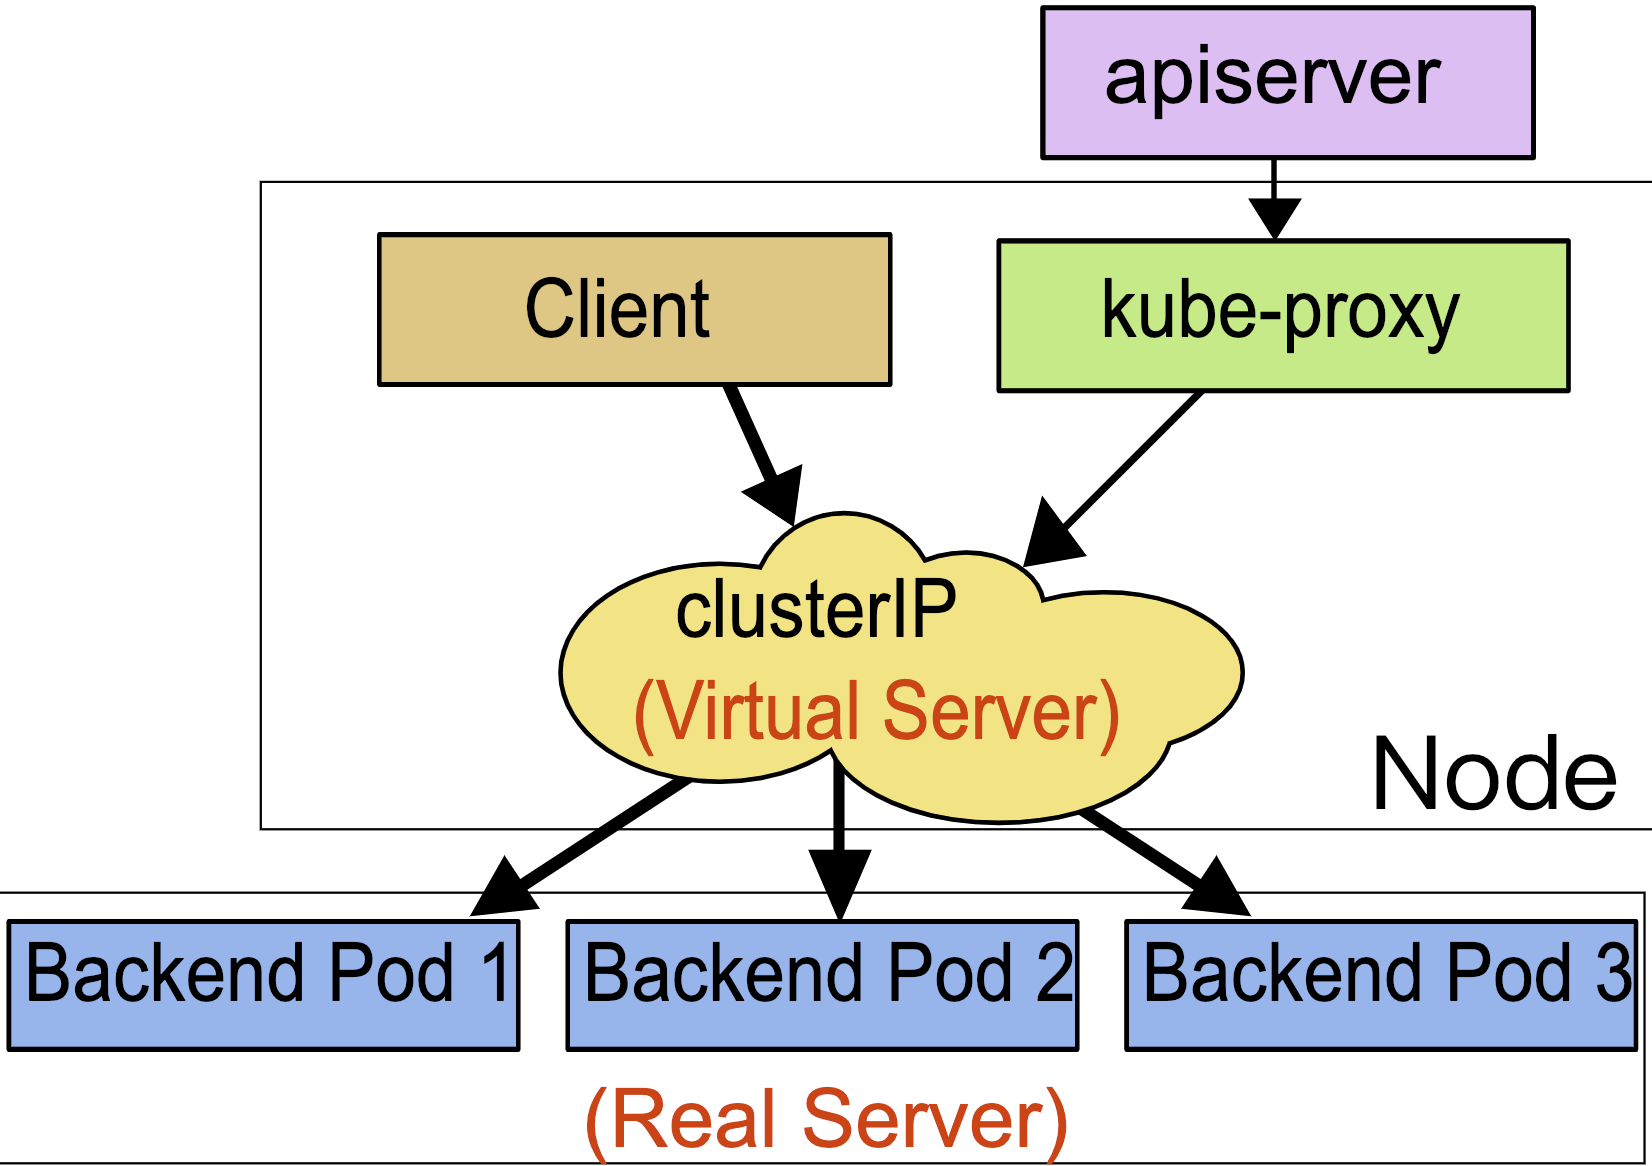
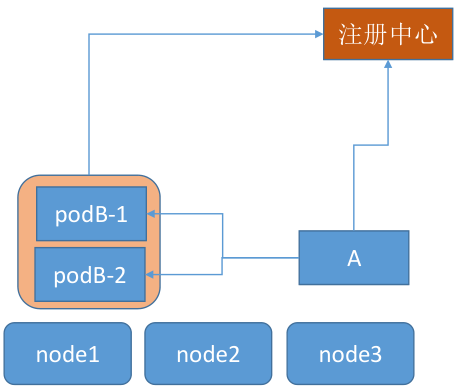
在 kubernetes 中,当创建带有多个副本的 deployment 时,kubernetes 会创建出多个 pod,此时即一个服务后端有多个容器,那么在 kubernetes 中负载均衡怎么做,容器漂移后 ip 也会发生变化,如何做服务发现以及会话保持?这就是 service 的作用,service 是一组具有相同 label pod 集合的抽象,集群内外的各个服务可以通过 service 进行互相通信,当创建一个 service 对象时也会对应创建一个 endpoint 对象,endpoint 是用来做容器发现的,service 只是将多个 pod 进行关联,实际的路由转发都是由 kubernetes 中的 kube-proxy 组件来实现,因此,service 必须结合 kube-proxy 使用,kube-proxy 组件可以运行在 kubernetes 集群中的每一个节点上也可以只运行在单独的几个节点上,其会根据 service 和 endpoints 的变动来改变节点上 iptables 或者 ipvs 中保存的路由规则

service 的工作原理

service 资源基于标签选择器将一组 pod 定义成一个逻辑组合,并通过自己的 ip 地址和端口调度代理请求至组内 pod 的对象之上,它向客户隐藏了真实的、处理用户请求的 pod 资源,使得客户端的请求看上去像是由 service 直接处理并进行响应一样

Service 对象的 IP 地址也称为 Cluster IP,是一种 VIP(虚拟 IP),k8s 集群内部的 VIP

service 网段不能跟机房网络、docker 网段、容器网段冲突,否则可能会导致网络不通

Service 以负载均衡的方式进行流量调度,Service 和 Pod 之间松耦合,创建 Service 和 Pod 的任务可由不同的用户分别完成

Service 通过 API Server 实时监控(watch)标签选择器匹配到的后端 Pod,不过 Service 并不直接链接至 Pod,它们中间还有一个中间层 --Endpoints资源对象,默认情况下,创建 Service 对象时,其关联的 Endpoints 对象会自动创建

endpoints controller 是负责生成和维护所有 endpoints 对象的控制器,监听 service 和对应 pod 的变化,更新对应 service 的 endpoints 对象。当用户创建 service 后 endpoints controller 会监听 pod 的状态,当 pod 处于 running 且准备就绪时,endpoints controller 会将 pod ip 记录到 endpoints 对象中,因此,service 的容器发现是通过 endpoints 来实现的。而 kube-proxy 会监听 service 和 endpoints 的更新并调用其代理模块在主机上刷新路由转发规则

Endpoints 是一个由 IP 地址和端口组成的列表,这些 IP 和端口来自于其 Service 关联的 Pod

每个节点上的 kube-proxy 组件 watch 各 Service 及其关联的 Endpoints,如果有变动,就会实时更新当前节点上相应的 iptables 或 ipvs 规则,确保 Cluster IP 的流量能调度到 Endpoints

简单来讲,一个 Service 对象就是一个 Node 上的这些 iptables 和 ipvs 规则

service 的负载均衡

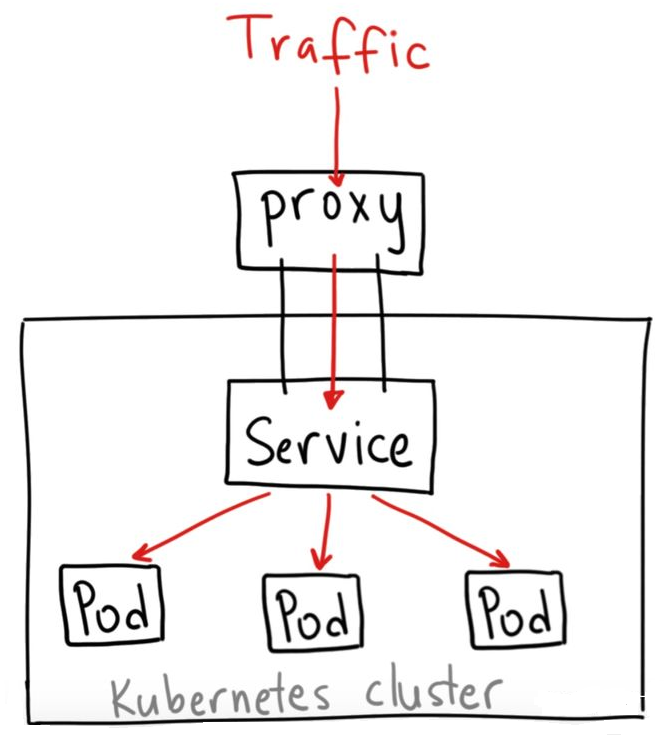
pod 之间通信,一般不会 pod 直接访问 pod,而是 pod 先访问 service,然后 service 再到 pod

关于将 Cluster IP 的流量能调度到 Endpoints,有三种方式:userspace 代理、iptables 代理、ipvs 代理

  1. userspace 代理

    1.1 版本之前的默认代理模型,效率低

  2. iptables 代理

    通过 iptables 进行目标地址转换和流量调度,缺点是不会在后端 Pod 资源无响应时自动进行重定向

  3. ipvs 代理

    和 iptables 代理模型的区别仅在于,流量的调度功能由 ipvs 实现,其他功能仍由 iptables 完成

service 的类型

service 支持的类型也就是 kubernetes 中服务暴露的方式,默认有四种:ClusterIP、NodePort、LoadBalancer、ExternelName

ClusterIP

kubernetes 集群默认的服务暴露方式,它只能用于集群内部通信,可以被各 pod 访问,其访问方式为:

1
2
3
pod ---> ClusterIP:ServicePort --> (iptables)DNAT --> PodIP:containePort

# 集群内pod直接访问service的ip即可

NodePort

如果想要在集群外访问集群内部的服务,可以使用 NodePort 类型的 service,在集群内部署了 kube-proxy 的节点打开一个指定的端口,将访问 node 此端口的流量直接发送到这个端口,然后会被转发到 service 后端真实的服务进行访问。Nodeport 构建在 ClusterIP 上,其访问链路如下所示:

1
2
3
4
client ---> NodeIP:NodePort ---> ClusterIP:ServicePort ---> (iptables)DNAT ---> PodIP:containePort

# 外部流量请求先到node,再到service
# 只要安装了kube-proxy的node,都可以处理外部流量,有实力的话可以单独拿出几个node,打上污点,然后负载均衡只会将外部流量转发到这几个node

LoadBalancer

主要在公有云如阿里云、AWS 上使用,LoadBalancer 构建在 nodePort 基础之上,通过公有云服务商提供的负载均衡器将 k8s 集群中的服务暴露到外网,云厂商的 LoadBalancer 会给用户分配一个 IP,之后通过该 IP 的流量会转发到你的 service 上

LoadBalancer service 类型的结构如下图所示:

ExternelName

通过 CNAME 将 service 与 externalName 的值(比如:http://foo.bar.example.com)映射起来,这种方式用的比较少。

service 的服务发现

Pod 与 Service 的 DNS:https://kubernetes.io/zh/docs/concepts/services-networking/dns-pod-service/

虽然 service 的 endpoints 解决了容器发现问题,但不提前知道 service 的 Cluster IP,怎么发现 service 服务呢?service 当前支持两种类型的服务发现机制,一种是通过环境变量,另一种是通过 DNS。在这两种方案中,建议使用后者:

在集群中部署 CoreDNS 服务, 来达到集群内部的 pod 通过 DNS 的方式进行集群内部各个服务之间的通讯

当前 kubernetes 集群默认使用 CoreDNS 作为默认的 DNS 服务,主要原因是 CoreDNS 是基于 Plugin 的方式进行扩展的,简单,灵活,并且不完全被 Kubernetes 所捆绑

service 的使用

ClusterIP 方式

1
2
3
4
5
6
7
8
9
10
11
12
13
14
apiVersion: v1
kind: Service
metadata:
name: my-nginx #service的名称,此名称会被DNS解析
spec:
clusterIP: 10.105.146.177
ports:
- port: 80 # Service的端口号
protocol: TCP
targetPort: 8080 # 后端目标进程的端口号或名称,名称需由Pod规范定义
selector:
app: my-nginx
sessionAffinity: None
type: ClusterIP

NodePort 方式

1
2
3
4
5
6
7
8
9
10
11
12
13
14
apiVersion: v1
kind: Service
metadata:
name: my-nginx
spec:
ports:
- nodePort: 30090 # 节点端口,kube-proxy监听本机此端口,将访问此端口的流量转发到service
port: 80 # service端口
protocol: TCP
targetPort: 8080 # 目标pod端口
selector:
app: my-nginx
sessionAffinity: None
type: NodePort

Headless service(就是没有 Cluster IP 的 service )

当不需要负载均衡以及单独的 ClusterIP 时,可以通过指定 spec.clusterIP 的值为 None 来创建 Headless service,它会给一个集群内部的每个成员提供一个唯一的 DNS 域名来作为每个成员的网络标识,集群内部成员之间使用域名通信。

deployment 中对应的服务是 service,而 statefulset 中与之对应的服务就是 headless service

1
2
3
4
5
6
7
8
9
10
11
12
13
apiVersion: v1
kind: Service
metadata:
name: my-nginx
spec:
clusterIP: None
ports:
- nodePort: 30090
port: 80
protocol: TCP
targetPort: 8080
selector:
app: my-nginx

Ingress

https://kubernetes.io/zh/docs/concepts/services-networking/ingress/
https://kubernetes.io/zh/docs/concepts/services-networking/ingress-controllers/

上面介绍的 ClusterIP 、NodePort 、LoadBalancer 都是基于 ip 和 port 做负载均衡,属于四层负载均衡

Ingress 可以作用于多个 service,被称为 service 的 service,作为集群内部服务的入口,Ingress 其实就是七层的反向代理,可以根据不同的 url,将请求转发到不同的 service 上

Ingress 的结构如下图所示:

kube-proxy 监听 node 的指定端口,将此端口的流量转发到 ingress,然后 ingress 再转发到不同的 service

1
2
3
4
5
反正都是实现七层代理,也可以使用deployment创建一组pod,提供nginx服务,实现代替ingress的效果:

kube-proxy监听node的指定端口,将此端口的流量转发到nginx service,然后nginx在转发到不同的service,可以配置service ip,也可以使用服务发现

建议:域名多、流量大,使用nginx;反之使用ingress

其他服务类型

完全不使用 k8s 内置的 service,而是通过注册中心自动发现 pod 地址,如果开发有实力,推荐使用这种方式

网上的教程基本都给 dumpcap 设置 suid,修改 dumpcap 的属组为 wireshark,将 whoami 添加到 wireshark 附属组。其实后面的都是多余操作,只需给 dumpcap 设置 suid 即可。

1
sudo chmod u+s /usr/bin/dumpcap

什么是 k8s?

kubernetes:容器的管理和编排系统

k8s 由多个组件组成,部署在一群服务器之上,将所有服务器整合成一个资源池,然后向客户端提供各种接口, 客户端只需要调用相应接口就可以管理容器,至于底层容器具体跑在哪台服务器,不可见也不需要关心

针对各种特定的业务,尤其是比较依赖工程师经验的业务(例如数据库集群宕机后的数据恢复、各种集群的扩缩容),可以将一系列复杂操作代码化,这个代码在 k8s 中就叫 operator,只要用好各种 operator,就可以方便高效的解决各种问题,这样,运维工程师的主要工作就变成了维护 k8s,确保 k8s 自身能够良好运行

k8s 内置了各种 operator,但是这些 operator 更重视通用性,很难完全匹配实际工作需要,所以就需要对 k8s 进行二次开发,编写各种 operator,这也是 SRE 工程师的必备技能之一

operator 能单独管理应用集群,实现复杂操作;controllor:控制器,只能实现简单的容器操作

开发人员为 k8s 开发应用程序的时候,通常不会完整的部署一个分布式 k8s 集群,而是使用一个叫做 MiniKube,它可以在单机上模拟出一个完整意义上的 k8s 集群

节点

资源池中的各个服务器叫做节点,节点有两种:

  • Worker Node:运行 Pod,一般称 Node
  • Master Node:运行控制平面组件,不运行 pod,一般称为 Master

组件

k8s 组件分为三种: 控制平面组件Node 组件Addons

https://kubernetes.io/docs/concepts/overview/components/

控制平面组件

控制平面(control plane)管理 Node 和 Node 上的 Pods

控制平面组件可以分别运行在任意节点上,但是为了简单,通常会将所有控制平面组件运行在同一个节点上,还可以以副本的形式运行在多个节点上,然后禁止在这种节点上运行 pod,这种节点就叫做 Master Node(后文简称 Master),当集群中只有一个 Master 时,就是单控制平面,有多个 Master 时,就是多控制平面,生产中肯定是多控制平面,但是学习中一般只使用单控制平面

kube-apiserver

https 服务器,监听在 6443 端口,它将 k8s 集群内的一切都抽象成资源,提供 RESTful 风格的 API,对资源(对象)进行增删改查等管理操作

apiserver 是整个 k8s 系统的总线,所有组件之间,都是通过它进行协同,它是唯一可以存储 k8s 集群的状态信息的组件(储存在 Etcd)

生产中,apiserver 需要做冗余,因为无状态,所以最少部署两个 apiserver,因为是 https 服务器,所以需要做四层负载,使用 Nginx、HAProxy、LVS 均可,然后搭配 keepalived 给负载均衡做高可用

关于健康监测,分为 AH(主动监测)和 PH(被动监测或者叫异常值探测)

kube-controller-manager

控制器管理器,负责管理控制器,真正意义上让 k8s 所有功能得以实现的控制中心,controller-manager 中有很多 controller(deployment 等数十种),这些 controller 才是真正意义上的 k8s 控制中心,负责集群内的 Node、Pod 副本、服务端点(Endpoint)、命名空间(Namespace)、服务账号(ServiceAccount)、资源定额(ResourceQuota)的管理

当某个 Node 意外宕机时,Controller Manager 会及时发现并执行自动化修复流程,确保集群始终处于预期(yaml 配置文件指定)的工作状态

k8s 可以把运维人员日常重复性的工作代码化,就是将多 controller 打包起来,单一运行

默认监听本机的 10252 端口

controller loop:控制循环

kube-scheduler

调度器,调度 pod,它的核心作用就是运行应用,scheduler 时刻关注着每个节点的资源可用量,以及运行 pod 所需的资源量,让二者达到最佳匹配,让 pod 以最好的状态运行

在整个系统中起”承上启下”作用,承上:负责接收 Controller Manager 创建的新的 Pod,为其选择一个合适的 Node;启下:Node 上的 kubelet 接管 Pod 的生命周期

1
2
3
4
5
6
7
8
9
10
通过调度算法为待调度Pod列表的每个Pod从可用Node列表中选择一个最适合的Node,并将信息写入etcd中node节点上的kubelet通过API Server监听到kubernetes Scheduler产生的Pod绑定信息,然后获取对应的Pod清
单,下载Image,并启动容器

优选策略:
1.LeastRequestedPriority
优先从备选节点列表中选择资源消耗最小的节点(CPU+内存)
2.CalculateNodeLabelPriority
优先选择含有指定Label的节点。
3.BalancedResourceAllocation
优先从备选节点列表中选择各项资源使用率最均衡的节点

etcd

https://etcd.io/
https://github.com/etcd-io/etcd

第三方、非 k8s 内置,它的目标是构建一个高可用的分布式键值(key-value)数据库,为避免脑裂,通常部署 3 个或 5 个节点

1
2
3
4
5
6
7
完全复制  # 集群中的每个节点都可以使用完整的存档
高可用性 # Etcd可用于避免硬件的单点故障或网络问题
一致性 # 每次读取都会返回跨多主机的最新写入
简单 # 包括一个定义良好、面向用户的API(gRPC)
安全 # 实现了带有可选的客户端证书身份验证的自动化TLS
快速 # 每秒10000次写入的基准速度
可靠 # 使用Raft算法实现了存储的合理分布Etcd的工作原理

etcd 有多个不同的 API 访问版本,v1 版本已经废弃,etcd v2 和 v3 本质上是共享同一套 raft 协议代码的两个独立的应用,接口不一样,存储不一样,数据互相隔离。也就是说如果从 Etcd v2 升级到 Etcd v3,原来 v2 的数据还是只能用 v2 的接口访问,v3 的接口创建的数据也只能访问通过 v3 的接口访问

以下以内容以 v3 为准

etcdctl 是 etcd 的命令行客户端工具

1
etcdctl [options] command [command options] [arguments...]
管理成员
1
2
3
4
5
etcdctl member list
etcdctl member add
etcdctl member promote
etcdctl member remove
etcdctl member update

验证成员状态:

1
2
3
4
5
6
7
$etcdctl endpoint health \
--endpoints=https://10.0.1.31:2379 \
--cacert=/etc/kubernetes/ssl/ca.pem \
--cert=/etc/etcd/ssl/etcd.pem \
--key=/etc/etcd/ssl/etcd-key.pem

# 多个成员写个遍历即可
增删改查
  • 增 put

    1
    2
    3
    4
    5
    6
    7
    etcdctl put [options] <key> <value> (<value> can also be given from stdin) [flags]

    $etcdctl put /testkey "test data"
    OK

    $etcdctl get --print-value-only /testkey
    test data
  • 删 del

    1
    2
    3
    4
    etcdctl del [options] <key> [range_end] [flags]

    $etcdctl del /testkey
    1
  • 改 put

    直接覆盖即可

    1
    2
    $etcdctl put /testkey "test data2"
    OK
  • 查 get

    1
    2
    3
    4
    5
    6
    7
    8
    9
    10
    etcdctl get [options] <key> [range_end] [flags]

    $etcdctl get --print-value-only /testkey
    test data2

    $etcdctl get --prefix --keys-only / # 获取所有key
    $etcdctl get --prefix --keys-only /calico
    $etcdctl get --prefix --keys-only /registry
    $etcdctl get --prefix --keys-only /registry/services
    $etcdctl get /calico/ipam/v2/handle/ipip-tunnel-addr-k8s-master.ljk.local
watch 机制

etcd v3 的 watch 机制支持 watch 某个固定的 key,也支持 watch 一个范围,发生变化就主动触发通知客户端

相比 Etcd v2, Etcd v3 的一些主要变化:

1
2
3
4
5
1. 接口通过grpc提供rpc接口,放弃了v2的http接口,优势是长连接效率提升明显,缺点是使用不如以前方便,尤其对不方便维护长连接的场景。
2. 废弃了原来的目录结构,变成了纯粹的kv,用户可以通过前缀匹配模式模拟目录
3. 内存中不再保存value,同样的内存可以支持存储更多的key
4. watch机制更稳定,基本上可以通过watch机制实现数据的完全同步
5. 提供了批量操作以及事务机制,用户可以通过批量事务请求来实现Etcd v2的CAS机制(批量事务支持if条件判断)

watch 测试:

1
2
3
4
5
6
# 在 etcd node1 上watch一个key,没有此 key 也可以执行 watch,后期可以再创建
$etcdctl watch /testkey

# 在 etcd node2 修改数据,验证 etcd node1 是否能够发现数据变化
$etcdctl put /testkey "test for new"
OK
数据备份与恢复机制

v2 版本数据备份与恢复:

1
2
3
4
5
# 备份
etcdctl backup --data-dir /var/lib/etcd/ --backup-dir /opt/etcd_backup

# 恢复
etcd --data-dir=/var/lib/etcd/default.etcd --force-new-cluster &

v3 版本数据备份与恢复:

1
2
3
etcdctl snapshot <subcommand> [flags]

subcommand:save、restore、status
1
2
3
4
5
6
7
8
$etcdctl snapshot save snapshot.db  # 备份
...
Snapshot saved at snapshot.db
$file snapshot.db
snapshot.db: data

# 恢复,将数据恢复到一个新的不存在的目录中
etcdctl snapshot restore snapshot.db --data-dir=/opt/etcd-testdir

cloud-controller-manager

略…

Node 组件

Node 组件运行在所有的节点上,包括 Master

kubelet

与 api server 建立联系,监视 api server 中与自己 node 相关的 pod 的变动信息,执行指令操作

在 kubernetes 集群中,每个 Node 节点都会启动 kubelet 进程,处理 Master 节点下发到本节点的任务,管理 Pod 和其中的容器。kubelet 会在 API Server 上注册节点信息,定期向 Master 汇报节点资源使用情况,并通过 cAdvisor(顾问)监控容器和节点资源,可以把 kubelet 理解成 Server/Agent 架构中的 agent,kubelet 是 Node 上的 pod 管家

kube-porxy

https://kubernetes.io/zh/docs/concepts/services-networking/service/
https://kubernetes.io/zh/docs/reference/command-line-tools-reference/kube-proxy/

守护进程,管理当前节点的 iptables 或 ipvs 规则,而且管理的只是和 service 相关的规则

监控 service,把集群上的每一个 service 的定义转换为本地的 ipvs 或 iptables 规则

kube-proxy 是运行在集群中的每个节点上的网络代理,实现了 Kubernetes 服务概念的一部分
kube-proxy 维护节点上的网络规则。这些网络规则允许从集群内部或外部的网络会话到 Pods 进行网络通信
kube-proxy 使用操作系统包过滤层(如果有的话)并且它是可用的。否则,kube-proxy 将自己转发流量

Container runtime

通常是 docker,其他类型的容器也支持

Addons

附加组件扩展了 Kubernetes 的功能

插件使用 Kubernetes 资源(DaemonSet, Deployment,等等)来实现集群特性。因为它们提供了集群级的特性,所以插件的命名空间资源属于 kube-system 命名空间

DNS

CoreDNS,k8s 中,DNS 是至关重要的,所有的访问都不会基于 ip,而是基于 name,name 再通过 DNS 解析成 ip

Web UI

集群监控系统

prometheus

集群日志系统

EFK、LG

Ingress Controller

入栈流量控制器,是对集群中服务的外部访问进行管理的 API 对象,典型的访问方式是 HTTP。

附件千千万,按需部署

CNI

CNI:Container Network Interface,容器网络接口

kubernetes 的网络插件遵从 CNI 规范的 v0.4.0 版本

网络插件有很多,最常用的是 flannel 和 Project Calico,生产环境用后者的最多

跨主机 pod 之间通信,有两种虚拟网络,有两种:overlay 和 underlay

  • overlay:叠加网络 ,搭建隧道
  • underlay:承载网络,设置路由表

overlay

OverLay 其实就是一种隧道技术,VXLAN,NVGRE 及 STT 是典型的三种隧道技术,它们都是通过隧道技术实现大二层网络。将原生态的二层数据帧报文进行封装后在通过隧道进行传输。总之,通过 OverLay 技术,我们在对物理网络不做任何改造的情况下,通过隧道技术在现有的物理网络上创建了一个或多个逻辑网络即虚拟网络,有效解决了物理数据中心,尤其是云数据中心存在 的诸多问题,实现了数据中心的自动化和智能化

以 flannel 为例,默认网段 10.224.1.0/16,flannel 在每个节点创建一个网卡 flannel.1,这是一个隧道,网段 10.2441.0/32 - 10.244.255/32,而每个节点上的容器的 ip 为 10.244.x.1/24 - 10.244.x.254/24,也就是说 flannel 默认支持最多 256 个节点,每个节点上又最多支持 256 个容器

underlay

UnderLay 指的是物理网络,它由物理设备和物理链路组成。常见的物理设备有交换机、路由器、防火墙、负载均衡、入侵检测、行为管理等,这些设备通过特定的链路连接起来形成了一个传统的物理网络,这样的物理网络,我们称之为 UnderLay 网络

UnderLay 是底层网络,负责互联互通而 Overlay 是基于隧道技术实现的,overlay 的流量需要跑在 underlay 之上

资源

Pod、Deployment、Service 等等,反映在 Etcd 中,就是一张张的表

kube-apiserver 以群组分区资源,群组化管理的 api 使得其可以更轻松地进行扩展,常用的 api 群组分为两类:

  1. 命名群组:/apis/$GROUP_NAME/$VERSION,例如 /apis/apps/v1
  2. 核心群组 core:简化了路径,/api/$VERSION,即 /api/v1

打印 kube-apiserver 支持的所有资源:

1
kubectl api-resources

对象

资源表中的每一条数据项就是一个对象,例如 Pod 表中的数据项就是 Pod 对象。所以资源表通常不叫 Pod 表、Deployment 表…,而是叫做 PodList、DeploymentList…

创建对象

三种方式

  1. 命令式命令:命令,全部配置通过选项指定
  2. 命令式配置文件:命令,加载配置文件
  3. 声明式配置文件:声明式命令,加载配置清单,推荐使用

配置清单:

1
2
3
4
5
6
7
8
9
10
11
12
# 配置清单的规范叫做资源规范,范例:
apiVersion: v1
kind: Pod
metadata:
name: myPod
labels:
app: mypod
release: canary
spec: # 期望状态
containers:
- name: demoapp
image: ikubernetes/demoapp:v1.0

资源清单是 yml 格式,api-server 会自动转成 json 格式

如果实际状态和期望状态有出入,控制器的控制循环就会监控到差异,然后将需要做出的更改提交到 apiserver,调度器 scheduler 监控到 apiserver 中有未执行的操作,就会去找适合执行操作的 node,然后提交到 apiserver,kubelet 监控到 apiserver 中有关于自己节点的操作,就会执行操作,将执行结果返回给 apiserver,apiserver 再更新实际状态

查看对象

外部访问

1
2
3
4
5
domain:6643/apis/$GROUP_NAME/$VERSION/namespaces/$NAMESPACE/$NAME/$API_RESOURCE_NAME
domain:6643/api/$VERSION/namespaces/$NAMESPACE/$NAME/$API_RESOURCE_NAME

# 范例:
domain:6643/api/v1/namespaces/default/pods/demoapp-5f7d8f9847-tjn4v

内部访问

以下三种访问方式是一样的:

1
2
3
4
5
6
7
# 方式一,这种方式最方便
kubectl get pods net-tes1 -o json|yaml
# 方式二
kubectl get --raw /api/v1/namespaces/default/pods/net-test1
# 方式三,这种方式适用于监控
kubectl proxy # 搭建代理
curl 127.0.0.1:8001/api/v1/namespaces/default/pods/net-test1 # 另起一终端

注:1.20 之前的版本可以直接curl 127.0.0.1:8080,并且通过--insecure-port可以修改默认的 8080 端口,1.20.4 之后的版本取消了这种不安全的访问方式,只能通过以上方式三,先kubectl proxy代理一下,默认端口也改成了 8001

The kube-apiserver ability to serve on an insecure port, deprecated since v1.10, has been removed. The insecure address flags --address and --insecure-bind-address have no effect in kube-apiserver and will be removed in v1.24. The insecure port flags --port and --insecure-port may only be set to 0 and will be removed in v1.24. (#95856, @knight42, [SIG API Machinery, Node, Testing])

1
2
3
4
5
6
$kubectl get pods net-test1 -o yaml
apiVersion: v1
kind: Pod
>metadata:
>spec:
>status:

以上返回的数据,每个字段表示的意义可以通过 kubectl explain 查询帮助

1
kubectl explain <type>.<fieldName>[.<fieldName>]
1
2
3
4
5
6
7
8
9
10
11
12
13
14
15
16
$kubectl explain pod.apiVersion
KIND: Pod
VERSION: v1

FIELD: apiVersion <string>

DESCRIPTION:
APIVersion defines the versioned schema of this representation of an
object. Servers should convert recognized schemas to the latest internal
value, and may reject unrecognized values. More info:
https://git.k8s.io/community/contributors/devel/sig-architecture/api-conventions.md#resources

# 范例
$kubectl explain pod.kind
$kubectl explain pod.metadata
$kubectl explain pod.spec

lease 租约

lease 是分布式系统中一个常见的概念,用于代表一个分布式租约。典型情况下,在分布式系统中需要去检测一个节点是否存活的时,就需要租约机制。

上图示例中的代码示例首先创建了一个 10s 的租约,如果创建租约后不做任何的操作,那么 10s 之后,这个租约就会自动过期。接着将 key1 和 key2 两个 key value 绑定到这个租约之上,这样当租约过期时 etcd 就会自动清理掉 key1 和 key2,使得节点 key1 和 key2 具备了超时自动删除的能力。

如果希望这个租约永不过期,需要周期性的调用 KeeyAlive 方法刷新租约。比如说需要检测分布式系统中一个进程是否存活,可以在进程中去创建一个租约,并在该进程中周期性的调用 KeepAlive 的方法。如果一切正常,该节点的租约会一致保持,如果这个进程挂掉了,最终这个租约就会自动过期。

在 etcd 中,允许将多个 key 关联在同一个 lease 之上,这个设计是非常巧妙的,可以大幅减少 lease 对象刷新带来的开销。试想一下,如果有大量的 key 都需要支持类似的租约机制,每一个 key 都需要独立的去刷新租约,这会给 etcd 带来非常大的压力。通过多个 key 绑定在同一个 lease 的模式,我们可以将超时间相似的 key 聚合在一起,从而大幅减小租约刷新的开销,在不失灵活性同时能够大幅提高 etcd 支持的使用规模。

tomcat 日志

tomcat 默认的格式比较简单,包含 ip、date、method、url、status code 等信息,例如:

1
2
3
4
5
6
7
8
9
10
11
12
13
10.0.0.1 - - [06/Mar/2021:09:26:09 +0800] "GET / HTTP/1.1" 200 11156
10.0.0.1 - - [06/Mar/2021:09:26:10 +0800] "GET /tomcat.svg HTTP/1.1" 200 67795
10.0.0.1 - - [06/Mar/2021:09:26:10 +0800] "GET /tomcat.css HTTP/1.1" 200 5542
10.0.0.1 - - [06/Mar/2021:09:26:10 +0800] "GET /bg-nav.png HTTP/1.1" 200 1401
10.0.0.1 - - [06/Mar/2021:09:26:10 +0800] "GET /bg-middle.png HTTP/1.1" 200 1918
10.0.0.1 - - [06/Mar/2021:09:26:10 +0800] "GET /bg-upper.png HTTP/1.1" 200 3103
10.0.0.1 - - [06/Mar/2021:09:26:10 +0800] "GET /bg-button.png HTTP/1.1" 200 713
10.0.0.1 - - [06/Mar/2021:09:26:10 +0800] "GET /asf-logo-wide.svg HTTP/1.1" 200 27235
10.0.0.1 - - [06/Mar/2021:09:26:10 +0800] "GET /favicon.ico HTTP/1.1" 200 21630
10.0.0.1 - - [06/Mar/2021:09:26:12 +0800] "GET /manager/status HTTP/1.1" 403 3446
10.0.0.1 - - [06/Mar/2021:09:26:14 +0800] "GET /manager/html HTTP/1.1" 403 3446
10.0.0.1 - - [06/Mar/2021:09:26:19 +0800] "GET / HTTP/1.1" 200 11156
10.0.0.1 - - [06/Mar/2021:09:26:19 +0800] "GET /favicon.ico HTTP/1.1" 200 21630
  1. 为了 kibana 能单独统计每个字段,需要日志记录成 json 格式,当然也可以是其他格式,只要有对应的 codec 插件可以解析就行

    1
    2
    3
    4
    5
    6
    7
    8
    9
    10
    11
    12
    13
    14
    15
    16
    17
    [root@elk2-ljk conf]$pwd
    /usr/local/tomcat/conf
    [root@elk2-ljk conf]$vim server.xml # 自定义日志格式 为json格式
    ...
    <Valve className="org.apache.catalina.valves.AccessLogValve" directory="logs"
    prefix="tomcat_access_log" suffix=".log"
    pattern="{&quot;clientip&quot;:&quot;%h&quot;,&quot;ClientUser&quot;:&quot;%l&quot;,&quot;authenticated&quot;:&quot;%u&quot;,&quot;AccessTime&quot;: &quot;%t&quot;,&quot;method&quot;:&quot;%r&quot;,&quot;status&quot;:&quot;%s&quot;,&quot;SendBytes&quot;:&quot;%b&quot;,&quot;Query?string&quot;:&quot;%q&quot;, &quot;partner&quot;:&quot;%{Referer}i&quot;,&quot;AgentVersion&quot;:&quot;%{User-Agent}i&quot;}" />
    ...

    # &quot; 表示双引号

    [root@elk2-ljk conf]$systemctl restart tomcat.service # 重启tomcat
    # 查看日志,已经成功修改为json格式
    [root@elk2-ljk logs]$cat ../logs/tomcat_access_log.2021-03-06.log
    {"clientip":"10.0.0.1","ClientUser":"-","authenticated":"-","AccessTime":"[06/Mar/2021:12:50:56 +0800]","method":"GET / HTTP/1.1","status":"200","SendBytes": "11156","Query?string":"","partner":"-","AgentVersion":"Mozilla/5.0 (Windows NT 6.1; Win64; x64) AppleWebKit/537.36 (KHTML, like Gecko) Chrome/88.0.4324.190 Safari/537.36"}
    {"clientip":"10.0.0.1","ClientUser":"-","authenticated":"-","AccessTime":"[06/Mar/2021:12:50:56 +0800]","method":"GET /favicon.ico HTTP/1.1","status":"200", "SendBytes":"21630","Query?string":"","partner":"http://10.0.1.122:8080/","AgentVersion":"Mozilla/5.0 (Windows NT 6.1; Win64; x64) AppleWebKit/537.36 (KHTML, like Gecko) Chrome/88.0.4324.190 Safari/537.36"}
    {"clientip":"10.0.0.1","ClientUser":"-","authenticated":"-","AccessTime":"[06/Mar/2021:12:51:00 +0800]","method":"GET / HTTP/1.1","status":"200","SendBytes": "11156","Query?string":"","partner":"-","AgentVersion":"Mozilla/5.0 (Windows NT 6.1; Win64; x64) AppleWebKit/537.36 (KHTML, like Gecko) Chrome/88.0.4324.190 Safari/537.36"}

    百度搜索 “tomcat 日志格式” 或 “apache 日志格式”,下面是部分格式说明:

    1
    2
    3
    4
    5
    6
    7
    8
    9
    10
    11
    12
    13
    14
    15
    16
    17
    18
    19
    20
    21
    22
    23
    24
    25
    26
    %a - 远程IP地址
    %A - 本地IP地址
    %b - 发送的字节数,不包括HTTP头,或“ - ”如果没有发送字节
    %B - 发送的字节数,不包括HTTP头
    %h - 远程主机名
    %H - 请求协议
    %l (小写的L)- 远程逻辑从identd的用户名(总是返回' - ')
    %m - 请求方法
    %p - 本地端口
    %q - 查询字符串(在前面加上一个“?”如果它存在,否则是一个空字符串
    %r - 第一行的要求
    %s - 响应的HTTP状态代码
    %S - 用户会话ID
    %t - 日期和时间,在通用日志格式
    %u - 远程用户身份验证
    %U - 请求的URL路径
    %v - 本地服务器名
    %D - 处理请求的时间(以毫秒为单位)
    %T - 处理请求的时间(以秒为单位)
    %I (大写的i) - 当前请求的线程名称

    %{XXX}i xxx代表传入的头(HTTP Request)
    %{XXX}o xxx代表传出​​的响应头(Http Resonse)
    %{XXX}c xxx代表特定的Cookie名
    %{XXX}r xxx代表ServletRequest属性名
    %{XXX}s xxx代表HttpSession中的属性名
  2. logstash 配置文件:

    1
    2
    3
    4
    5
    6
    7
    8
    9
    10
    11
    12
    13
    14
    15
    16
    17
    18
    input {
    file {
    type => "tomcat-access-log"
    path => "/usr/local/tomcat/logs/tomcat_access_log.*.log"
    start_position => "end"
    stat_interval => 3
    codec => "json"
    }
    }

    output {
    if [type] == "tomcat-access-log" {
    elasticsearch {
    hosts => ["10.0.1.121:9200"]
    index => "mytest-%{type}-%{+xxxx.ww}"
    }
    }
    }
  3. 重启 logstash,注意要以 root 用户身份启动,否则无法采集数据

    1
    [root@elk2-ljk conf.d]$systemctl restart logstash.service

java 日志

基于 java 开发的应用,都会有 java 日志,java 日志会记录 java 的报错信息,但是一个报错会产生多行日志,例如:

为了方便观察,需要将一个报错的多行日志合并为一行,以 elasticsearch 为例:

1
2
3
4
5
6
7
8
9
10
11
12
13
14
15
16
17
18
19
20
input {
file {
type => "elasticsearch-java-log"
path => "/data/elasticsearch/logs/es-cluster.log"
start_position => "beginning"
stat_interval => 3
codec => multiline {
pattern => "^\["
negate => true
what => "previous"
}
}
}

output {
elasticsearch {
hosts => ["10.0.1.121:9200"]
index => "mytest-%{type}-%{+yyyy.MM}"
}
}

查看 kibana:

nginx 访问日志

和采集 tomcat 日志类似,重点是把 nginx 日志修改为 json 格式

1
2
3
4
5
6
7
8
9
10
11
12
13
14
15
16
17
18
19
20
21
22
23
24
25
26
27
# 注意:log_format要写在server外面
[root@47105171233 vhost]$cat lujinkai.cn.conf
log_format access_json '{"@timestamp":"$time_iso8601",'
'"host":"$server_addr",'
'"clientip":"$remote_addr",'
'"size":$body_bytes_sent,'
'"responsetime":$request_time,'
'"upstreamtime":"$upstream_response_time",'
'"upstreamhost":"$upstream_addr",'
'"http_host":"$host",'
'"url":"$uri",'
'"domain":"$host",'
'"xff":"$http_x_forwarded_for",'
'"referer":"$http_referer",'
'"status":"$status"}';

server {
listen 80;
server_name lujinkai.cn;
access_log /data/wwwlogs/lujinkai.cn_nginx.log access_json;
rewrite / http://blog.lujinkai.cn permanent;
}

# 日志成功转为json格式
[root@47105171233 wwwlogs]$tail -f lujinkai.cn_nginx.log
{"@timestamp":"2021-03-06T18:20:13+08:00","host":"10.0.0.1","clientip":"113.120.245.191","size":162,"responsetime":0.000,"upstreamtime":"-","upstreamhost":"-","http_host":"lujinkai.cn","url":"/","domain":"lujinkai.cn","xff":"-","referer":"-","status":"301"}
{"@timestamp":"2021-03-06T18:20:13+08:00","host":"10.0.0.1","clientip":"113.120.245.191","size":162,"responsetime":0.000,"upstreamtime":"-","upstreamhost":"-","http_host":"lujinkai.cn","url":"/robots.txt","domain":"lujinkai.cn","xff":"-","referer":"-","status":"301"}

TCP/UDP 日志

场景:没有安装 logstash 的服务器(A),向安装了 logstash 的服务器(B)发送日志信息,这个场景不多

实现:A 通过 nc 命令给 B 发送日志信息,B 监听本地的对应端口,接收数据

A:客户端

1
[root@elk2-ljk ~]$nc 10.0.1.121 9889

B:服务端

1
2
3
4
5
6
7
8
9
10
11
12
13
input {
tcp {
port => 9889
type => "tcplog"
mode => "server"
}
}

output {
stdout {
codec => rubydebug
}
}

通过 rsyslog 收集 haproxy 日志

有些设备无法安装 logstash,例如 路由器、交换机,但是厂家内置了 rsyslog 功能,这里以 haproxy 为例

1
2
3
4
5
6
7
8
9
10
11
12
13
14
15
16
17
18
19
20
21
22
# 1. haproxy.cfg 定义haproxy的日志设备为local6
log 127.0.0.1 local6 info

# 2. rsyslog.conf
module(load="imudp")
input(type="imudp" port="514")
module(load="imtcp")
input(type="imtcp" port="514")
local6.* @@10.0.1.122

# 3. 10.0.1.122主机监听本机的udp514端口,接收日志数据
input{
syslog {
type => "ststem-rsyslog"
}
}
output{
elasticsearch {
hosts => ["10.0.1.123:9200"]
index => "logstash-rsyslog-%{+YYYY.MM.dd}"
}
}

filebeat 收集日志并写入 redis/kafka

考虑到 elasticsearch 的性能问题,通常不会直接往 elasticsearch 写日志,会加 redis 或 kafka 缓冲一下

  • 有少数场景,需要收集多个不同格式的日志,例如有的是 syslog 格式,有的是 json 格式,所有的日志都 output 到 redis 的一个 list 中,因为 logstash 的 input 没有条件判断,只能配置一个 codec,所以 logstash 可以将不同的日志发送到 elasticsearch 的不同 index,却无法对不同的日志格式配置不同的 codec,这样的数据最后展示在 kibana 也没有意义,解决方法是在日志收集和日志缓存中间在加一个 logstash(可以共用日志提取及过滤的 logstash),将不同的日志转发到 redis 的不同 list
  • 日志缓存如果用 redis,需要大内存,推荐 32G;如果用 kafka,16G 就够,因为 kafka 存储数据到磁盘

日志收集实战

从左向右看,当要访问 ELK 日志统计平台的时候,首先访问的是两台 nginx+keepalived 做的负载高可用,访问的地址是 keepalived 的 IP,当一台 nginx 代理服务器挂掉之后也不影响访问,然后 nginx 将请求转发到 kibana,kibana 再去 elasticsearch 获取数据,elasticsearch 是两台做的集群,数据会随机保存在任意一台 elasticsearch 服务器,redis 服务器做数据的临时保存,避免 web 服务器日志量过大的时候造成的数据收集与保存不一致导致的日志丢失,可以临时保存到 redis,redis 可以是集群,然后再由 logstash 服务器在非高峰时期从 redis 持续的取出即可,另外有一台 mysql 数据库服务器,用于持久化保存特定的数据,web 服务器的日志由 filebeat 收集之后发送给另外的一台 logstash,再有其写入到 redis 即可完成日志的收集,从图中可以看出,redis 服务器处于前端结合的最中间,其左右都要依赖于 redis 的正常运行,web 服务删个日志经过 filebeat 收集之后通过日志转发层的 logstash 写入到 redis 不同的 key 当中,然后提取层 logstash 再从 redis 将数据提取并安按照不同的类型写入到 elasticsearch 的不同 index 当中,用户最终通过 nginx 代理的 kibana 查看到收集到的日志的具体内容

通过坐标地图统计客户 IP 所在城市

https://www.elastic.co/guide/en/logstash/current/plugins-filters-geoip.html

日志写入数据库

写入数据库的目的是用于持久化保存重要数据,比如状态码、客户端 IP、客户端浏览器版本等等,用于后期按月做数据统计等

写个脚本从,定期从 elasticsearch 中获取数据,写入到 PostgreSQL

什么是 ELK

https://www.elastic.co/cn/what-is/elk-stack

ELK 全称 ELK Stack,它的更新换代产品叫 Elastic Stack

ELK = Elasticsearch + Logstash + Kibana

  • Elasticsearch:搜索和分析引擎
  • Logstash:服务器端数据处理管道,能够同时从多个来源采集数据,转换数据,然后将数据发送到诸如 Elasticsearch 等“存储库”中
  • Kibana:让用户在 Elasticsearch 中使用图形和图表对数据进行可视化

什么是 Elasticsearch

https://www.elastic.co/cn/what-is/elasticsearch

什么是 Logstash

Logstash 是 Elastic Stack 的核心产品之一,可用来对数据进行聚合和处理,并将数据发送到 Elasticsearch。Logstash 是一个开源的服务器端数据处理管道,允许您在将数据索引到 Elasticsearch 之前同时从多个来源采集数据,并对数据进行充实和转换。

什么是 kibana

https://www.elastic.co/cn/what-is/kibana

为什么使用 ELK

ELK 组件在海量日志系统的运维中,可用于解决以下主要问题:

  • 分布式日志数据统一收集,实现集中式查询和管理
  • 故障排查
  • 安全信息和事件管理
  • 报表功能

elasticsearch

基本概念

参考博客:https://www.cnblogs.com/qdhxhz/p/11448451.html

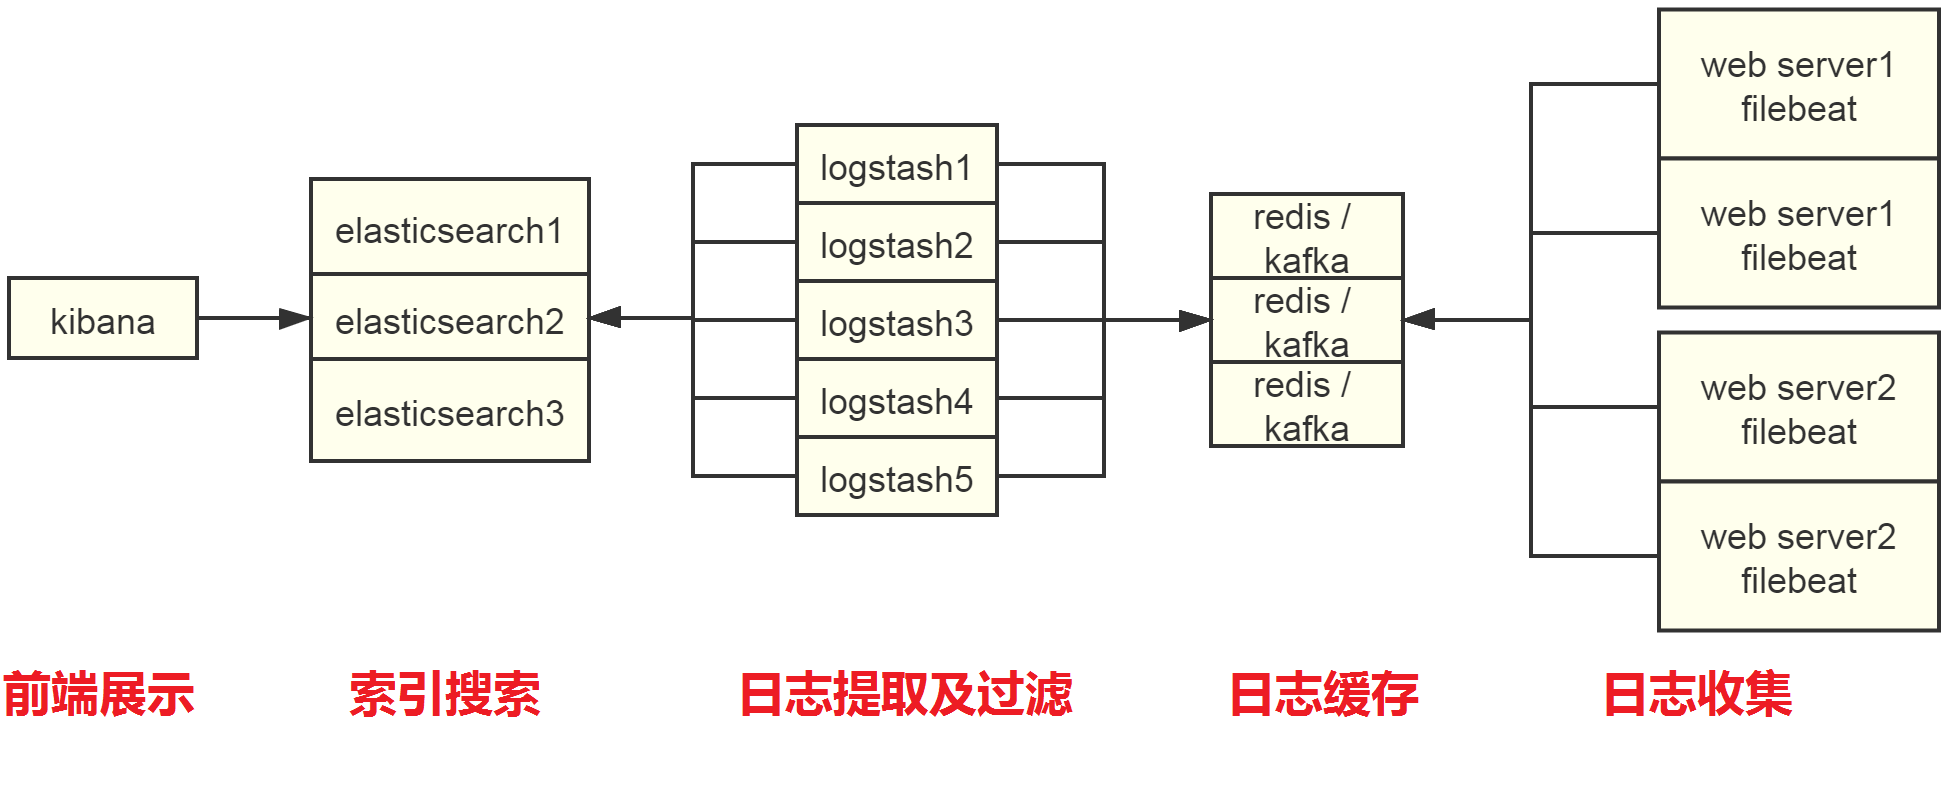
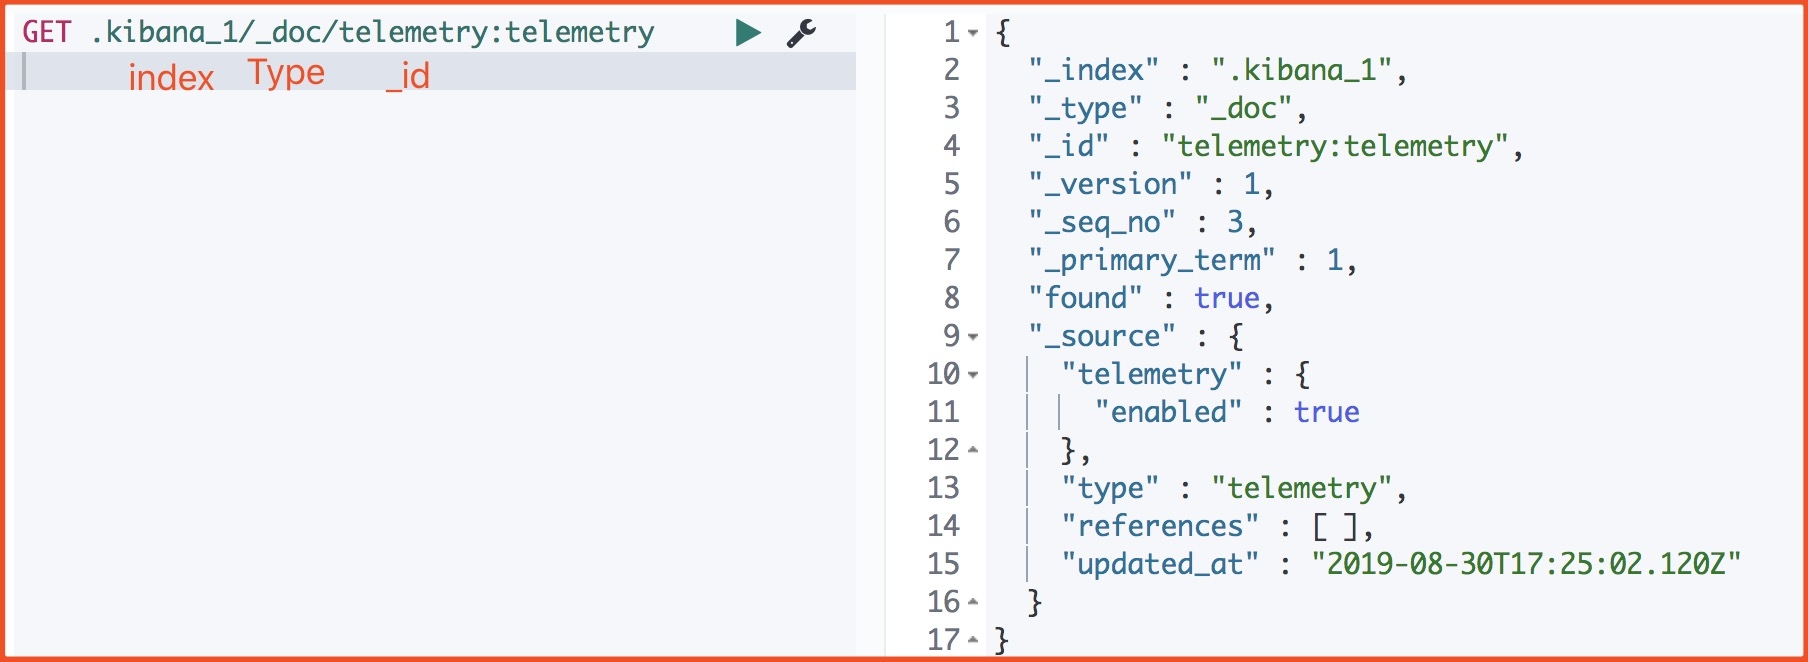
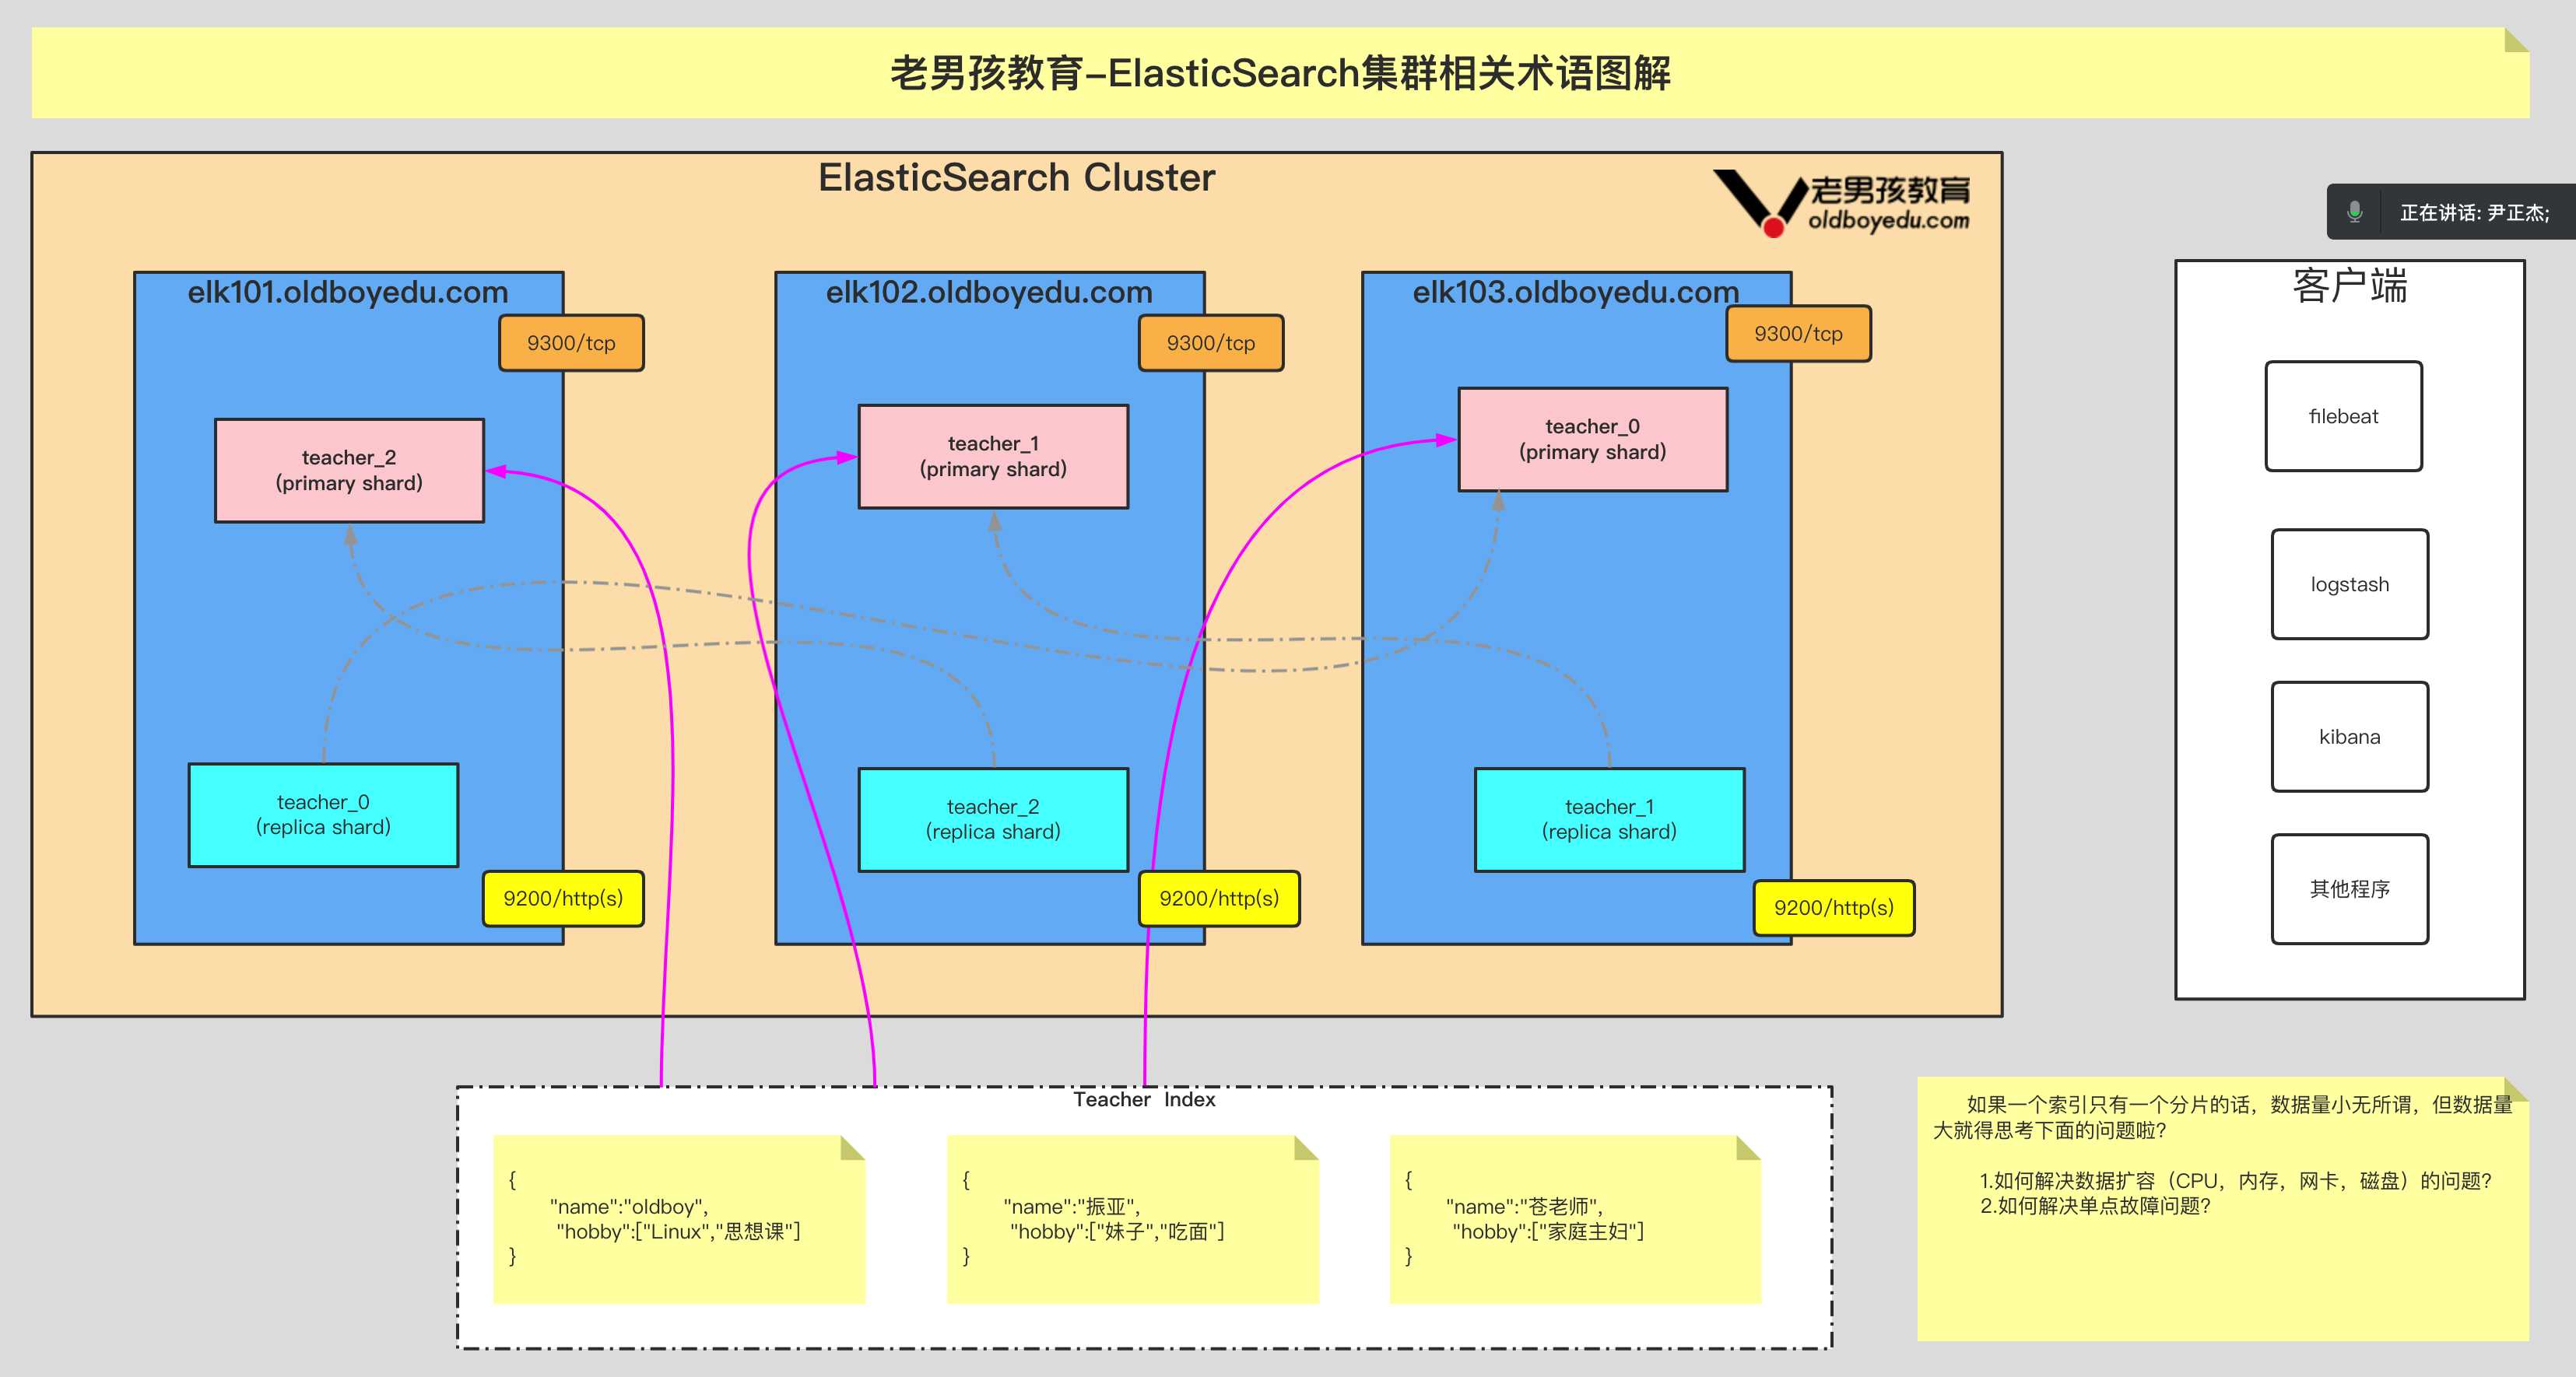
重点理解 index 和 document 这两个概念:index(索引)类似 kafka 的 topic,oss 的 bucket,要尽量控制 index 的数量;index 中的单条数据称为 document(文档),相当于 mysql 表中的行

之前的版本中,索引和文档中间还有个 type(类型)的概念,每个索引下可以建立多个 type,document 存储时需要指定 index 和 type,因为一个 index 中的 type 并不隔离,document 不能重名,所以 type 并没有多少意义。从 7.0 版本开始,一个 index 只能建一个名为_doc 的 type,8.0.0 以后将完全取消

下面是一个 document 的源数据:

  • _index:文档所属索引名称
  • _type:文档所属类型名
  • _id:doc 主键,写入时指定,如果不指定,则系统自动生成一个唯一的 UUID 值
  • _version:doc 版本信息,保证 doc 的变更能以正确的顺序执行,避免乱序造成的数据丢失
  • _seq_no:严格递增的顺序号,shard 级别严格递增,保证后写入的 doc 的_seq_no大于先写入的 doc 的_seq_no
  • _primary_term:和_seq_no一样是一个整数,每当 primary shard 发生重新分配时,比如重启,primary 选举等,_primary_term 会递增 1
  • found:查询的 ID 正确那么 ture, 如果 Id 不正确,就查不到数据,found 字段就是 false
  • _source:文档的原始 JSON 数据

apt 安装

elasticsearch 集群中 master 与 slave 的区别:

master:统计各节点状态信息、集群状态信息统计、索引的创建和删除、索引分配的管理、关闭节点等
slave:从 master 同步数据、等待机会成为 master

  1. apt 安装

    1
    [root@elk2-ljk src]$dpkg -i elasticsearch-7.11.1-amd64.deb

    主要目录:

    1
    2
    3
    /usr/share/elasticsearch # 主目录
    /etc/elasticsearch # 配置文件目录
    ...
  2. 修改 hosts

    1
    2
    3
    4
    5
    [root@elk2-ljk src]$vim /etc/hosts
    ...
    10.0.1.121 elk1-ljk.local
    10.0.1.122 elk2-ljk.local
    10.0.1.123 elk3-ljk.local
  3. 修改配置文件 elasticsearch.yml

    1
    2
    3
    4
    5
    6
    7
    8
    9
    10
    11
    12
    13
    14
    15
    [root@elk2-ljk /]$grep '^[a-Z]' /etc/elasticsearch/elasticsearch.yml
    cluster.name: es-cluster # ELK的集群名称,名称相同即属于是同一个集群
    node.name: node-2 # 当前节点在集群内的节点名称
    path.data: /data/elasticsearch/data # ES数据保存目录
    path.logs: /data/elasticsearch/logs # ES日志保存目
    bootstrap.memory_lock: true # 服务启动的时候锁定足够的内存,防止数据写入swap
    network.host: 10.0.1.122 # 监听本机ip
    http.port: 9200 # 监听端口
    # 集群中node节点发现列表,最好使用hostname,这里为了方便,使用ip
    discovery.seed_hosts: ["elk1-ljk.local", "elk2-ljk.local", "elk3-ljk.local"]
    # 集群初始化那些节点可以被选举为master
    cluster.initial_master_nodes: ["node-1", "node-2", "node-3"]
    gateway.recover_after_nodes: 2 # 一个集群中的 N 个节点启动后,才允许进行数据恢复处理,默认是 1
    # 设置是否可以通过正则或者_all 删除或者关闭索引库,默认 true 表示必须需要显式指定索引库名称,生产环境建议设置为 true,删除索引库的时候必须指定,否则可能会误删索引库中的索引库
    action.destructive_requires_name: true
  4. 修改内存限制

    1
    2
    3
    [root@elk2-ljk src]$vim /usr/lib/systemd/system/elasticsearch.service
    ...
    LimitMEMLOCK=infinity # 无限制使用内存
    1
    2
    3
    [root@elk2-ljk src]$vim /usr/local/elasticsearch/config/jvm.options
    -Xms2g # 最小内存限制
    -Xmx2g # 最大内存限制
  5. 创建数据目录并修改属主

    1
    2
    [root@elk2-ljk src]$mkdir -p /data/elasticsearch
    [root@elk3-ljk src]$chown -R elasticsearch:elasticsearch /data/elasticsearch
  6. 启动

    1
    2
    3
    4
    5
    6
    [root@elk1-ljk src]$systemctl start elasticsearch.service  # 稍等几分钟

    [root@elk1-ljk ~]$curl http://10.0.1.121:9200/_cat/nodes
    10.0.1.123 13 96 0 0.14 0.32 0.22 cdhilmrstw - node-3
    10.0.1.122 28 97 0 0.01 0.02 0.02 cdhilmrstw * node-2 # master
    10.0.1.121 26 96 2 0.13 0.07 0.03 cdhilmrstw - node-1

源码编译

启动总是失败,各种报错,解决不了…

安装 elasticsearch 插件

插件是为了完成不同的功能,官方提供了一些插件但大部分是收费的,另外也有一些开发爱好者提供的插件,可以实现对 elasticsearch 集群的状态监控与管理配置等功能

head 插件

在 elasticsearch 5.x 版本以后不再支持直接安装 head 插件,而是需要通过启动一个服务方式

github 地址:https://github.com/mobz/elasticsearch-head

1
2
3
4
5
6
7
8
9
10
11
12
13
14
# git太慢,这里用迅雷下载zip包,然后上传
[root@elk1-ljk src]$unzip master.zip
[root@elk1-ljk src]$cd elasticsearch-head-master/
[root@elk1-ljk elasticsearch-head-master]$npm install grunt -save
[root@elk1-ljk elasticsearch-head-master]$npm install # 这一步要等很久
[root@elk1-ljk elasticsearch-head-master]$npm run start # 前台启动

# 开启跨域访问支持,每个节点都需要开启
[root@elk3-ljk ~]$vim /etc/elasticsearch/elasticsearch.yml
...
http.cors.enabled: true
http.cors.allow-origin: "*"

[root@elk2-ljk games]$systemctl restart elasticsearch.service # 重启elasticsearch

kopf 插件

过时的插件,只支持 elasticsearc 1.x 或 2.x 的版本

cerebro 插件

新开源的 elasticsearch 集群 web 管理程序,需要 java11 或者更高版本

github 地址:https://github.com/lmenezes/cerebro

1
2
3
4
5
6
7
8
9
10
11
12
13
14
[root@elk2-ljk src]$unzip cerebro-0.9.3.zip
[root@elk2-ljk src]$cd cerebro-0.9.3/
[root@elk2-ljk cerebro-0.9.3]$vim conf/application.conf
...
# host列表
hosts = [
{
host = "http://10.0.1.122:9200"
name = "es-cluster1" # host的名称,如果有多个elasticsearch集群,可以用这个name区分
# headers-whitelist = [ "x-proxy-user", "x-proxy-roles", "X-Forwarded-For" ]
}
]

[root@elk2-ljk cerebro-0.9.3]$./bin/cerebro # 前台启动

监控 elasticsearch 集群状态

1
2
3
4
5
6
7
8
9
10
11
12
13
14
15
16
17
18
[root@elk3-ljk ~]$curl http://10.0.1.122:9200/_cluster/health?pretty=true
{
"cluster_name" : "es-cluster",
"status" : "green", # green:运行正常、yellow:副本分片丢失、red:主分片丢失
"timed_out" : false,
"number_of_nodes" : 3,
"number_of_data_nodes" : 3,
"active_primary_shards" : 0,
"active_shards" : 0,
"relocating_shards" : 0,
"initializing_shards" : 0,
"unassigned_shards" : 0,
"delayed_unassigned_shards" : 0,
"number_of_pending_tasks" : 0,
"number_of_in_flight_fetch" : 0,
"task_max_waiting_in_queue_millis" : 0,
"active_shards_percent_as_number" : 100.0
}

如果是单节点,status 会显示 yellow,设置副本数为 0 即可解决:

1
2
[root@elk1-ljk ~]$curl -X PUT "10.0.1.121:9200/_settings" -H 'Content-Type: application/json' -d' {"number_of_replicas":0}'
{"acknowledged":true}

或者:

zabbix 添加监控

logstash

官方参考文档:https://www.elastic.co/guide/en/logstash/current/index.html

logstash 是一个具有 3 个阶段的处理管道:输入 –> 过滤器 –> 输出  

输入生成事件,过滤器修改数据(日志),输出将数据(日志)发送到其他地方

安装

logstash 依赖 java,可以自己配置 java 环境,如果不配置,logstash 会使用其自带的 openjdk

1
2
3
4
5
6
7
8
[root@elk2-ljk src]$dpkg -i logstash-7.11.1-amd64.deb

# 修改启动用户为root,不然因为权限问题,后面会出现各种莫名其妙的错误,有些根本找不到报错
[root@elk2-ljk conf.d]$vim /etc/systemd/system/logstash.service
...
User=root
Group=root
...

命令

1
[root@elk2-ljk bin]$./logstash --help
  • -n:node name,就是节点的 hostname,例如:elk2-ljk.local

  • -f:从特定的文件或目录加载 logstash 配置。如果给定一个目录,该目录中的所有文件将按字典顺序合并,然后作为单个配置文件进行解析。您还可以指定通配符(globs),任何匹配的文件将按照上面描述的顺序加载

  • -e:从命令行加载 logstash 配置,一般不用

  • -t:检查配置文件是否合法,配合-f 使用,-f 指定配置文件,-t 检查

    1
    2
    # 示例:检查test.conf的合法性
    $/usr/share/logstash/bin/logstash -f /etc/logstash/conf.d/test.conf -t

插件

logstash 的输入和输出都依赖插件

不同的插件使用不同的配置,但是所有输入插件都支持以下配置选项:

配置项 类型 说明
add_field hash Add a field to an event
codec codec 用于输入数据的编解码器。输入编解码器是一种方便的方法,可以在数据进入输入之前对其进行解码,而不需要在 Logstash 管道中使用单独的过滤器
enable_metric boolean Disable or enable metric logging for this specific plugin instance by default we record all the metrics we can, but you can disable metrics collection for a specific plugin.
id string 唯一的 ID,如果没有指定,logstash 会自动生成一个,尤其是多个相同类型的插件时,强烈建议配置此项,例如有多个 file 输入,应当配置此项防止混淆
tags array Add any number of arbitrary tags to your event.
This can help with processing later.
type string 类型,例如收集 /var/log/syslog 日志,type 可以设置为 “system”;收集网站日志,type 可以设置为 “web”。
此项用的较多,一般会根据判断 type 值来进行输出或过滤

所有输出插件都支持以下配置选项:

配置项 类型 说明
codec codec 用于输出数据的编解码器。输出编解码器是一种方便的方法,可以在数据离开输出之前对数据进行编码,而不需要在 Logstash 管道中使用单独的过滤器
enable_metric boolean Disable or enable metric logging for this specific plugin instance. By default we record all the metrics we can, but you can disable metrics collection for a specific plugin.
id string 唯一的 ID,如果没有指定,logstash 会自动生成一个,尤其是多个相同类型的插件时,强烈建议配置此项,例如有多个 file 输出,应当配置此项防止混淆

可以看到 input 和 output 插件都支持 codec 配置项,input 的 codec 根据被采集的日志文件确定,如果日志是 json 格式,则 input 插件的 codec 应当设置为 json;而 output 的 codec 根据数据库确定,如果是 elasticsearch,codec 保持默认的 rubydebug 即可,如果是 kafka,codec 应该设置为 json

input 插件

stdin

标准输入

file

日志输出到文件

Setting 说明 备注
path 日志路径 必需
start_position 从文件的开头或者结尾开始采集数据 ["beginning", "end"]
stat_interval 日志收集的时间间隔 每个 input 文件都生成一个 .sincedb_xxxxx 文件,这个文件中记录了上次收集日志位置,下次从记录的位置继续收集

tcp

Setting 说明 备注
host 当 mode 是serverhost是监听的地址;
当 mode 是clienthost是要连接的地址
默认0.0.0.0
mode server:监听客户端连接;
client:连接到服务器;
[“server”, “client”]
port 监听的端口或要连接的端口 必需

kafka

Setting 说明 备注
bootstrap_servers host1:port1,host2:port2
topics 要订阅的 topic 列表,默认为[“logstash”]
decorate_events 是否添加一个 kafka 元数据,包含以下信息:
topic、consumer_group、partition、offset、key
布尔值
codec 设置为 json

output 插件

output

标准输出

elasticsearch

redis

Setting 说明 备注
key list(列表)名,或者 channel(频道)名,
至于是哪个取决于data_type
data_type 如果data_typelist,将数据 push 到 list;
如果data_type为 channel,将数据发布到 channel;
[“list”, “channel”]
host redis 主机列表,可以是 hostname 或者 ip 地址 数组
port redis 服务端口,默认 6379
db 数据库编号,默认 0
password 身份认证,默认不认证 不建议设置密码

写个脚本统计 redis 的 key 数量,使用 zabbix-agent 定时执行脚本,一旦 key 超过某个数量,就增加 logstash 数量,从而加快从 redis 中取数据的速度

kafka

Setting 说明 备注
bootstrap_servers host1:port1,host2:port2
topic_id 主题
codec 设置为 json
batch_size The producer will attempt to batch records together into fewer requests whenever multiple records are being sent to the same partition. This helps performance on both the client and the server. This configuration controls the default batch size in bytes. 默认 16384

codec 插件

multiline

合并多行,比如 java 的一个报错,日志中会记录多行,为了方便查看,应该将一个报错的多行日志合并成一行

Setting 说明 备注
pattern 正则匹配 必需
negate 匹配成功或失败,就开始多行合并 布尔值
what 如果模式匹配,向前多行合并,还是向后多行合并 必需,["previous", "next"]

配置

配置:https://www.elastic.co/guide/en/logstash/current/configuration.html
配置文件结构:https://www.elastic.co/guide/en/logstash/current/configuration-file-structure.html
配置文件语法:https://www.elastic.co/guide/en/logstash/current/event-dependent-configuration.html
使用环境变量:https://www.elastic.co/guide/en/logstash/current/environment-variables.html
配置文件示例:https://www.elastic.co/guide/en/logstash/current/config-examples.html
数据发送到 es:https://www.elastic.co/guide/en/logstash/current/connecting-to-cloud.html

1
2
3
4
5
6
7
8
9
10
11
input {
...
}

filter {
...
}

output {
...
}

多配置文件

https://www.elastic.co/guide/en/logstash/current/multiple-pipelines.html
https://elasticstack.blog.csdn.net/article/details/100995868

示例:

1
2
3
4
5
6
7
8
9
10
11
12
13
14
15
16
17
18
19
20
21
22
23
24
25
26
27
28
29
30
31
32
33
34
35
36
37
38
39
40
41
42
43
44
45
# 定义了两个管道
[root@elk2-ljk logstash]$cat pipelines.yml
- pipeline.id: syslog
path.config: "/etc/logstash/conf.d/syslog.conf"
- pipeline.id: tomcat
path.config: "/etc/logstash/conf.d/tomcat.conf"

# syslog.conf 和 tomcat.conf,没有使用条件判断语句做输出判断
[root@elk2-ljk conf.d]$cat syslog.conf
input {
file {
type => "syslog"
path => "/var/log/syslog"
start_position => "end"
stat_interval => 3
}
}

output {
if [type] == "syslog" {
elasticsearch {
hosts => ["10.0.1.121:9200"]
index => "mytest-%{type}-%{+xxxx.ww}"
}
}
}
[root@elk2-ljk conf.d]$cat tomcat.conf
input {
file {
type => "tomcat-access-log"
path => "/usr/local/tomcat/logs/tomcat_access_log.*.log"
start_position => "end"
stat_interval => 3
}
}

output {
elasticsearch {
hosts => ["10.0.1.121:9200"]
index => "mytest-%{type}-%{+xxxx.ww}"
}
}

# 启动,注意一定要以为root用户启动
[root@elk2-ljk conf.d]$systemctl restart logstash.service

效果:

测试

标准输入输出

1
2
3
4
5
6
7
8
9
10
11
12
13
14
15
16
17
18
[root@elk2-ljk conf.d]$cat /etc/logstash/conf.d/test.conf
input {
stdin {}
}

output {
stdout {}
}
[root@elk2-ljk conf.d]$/usr/share/logstash/bin/logstash -f /etc/logstash/conf.d/test.conf
... # 启动得等一会
[INFO ] 2021-03-04 18:10:06.020 [Api Webserver] agent - Successfully started Logstash API endpoint {:port=>9600}
hello word # 标准输入
{
"@timestamp" => 2021-03-04T10:10:15.528Z, # 当前事件的发生时间
"host" => "elk2-ljk.local", # 标记事件发生的节点
"@version" => "1", # 事件版本号,一个事件就是一个 ruby 对象
"message" => "hello word" # 息的具体内容
}

输出到文件

1
2
3
4
5
6
7
8
9
10
11
12
13
14
15
16
17
18
19
20
21
22
23
24
25
26
27
28
29
30
31
32
33
34
35
36
37
38
39
40
41
42
43
44
# 1. 修改被采集日志文件权限,至少让logstash用户可以读
[root@elk2-ljk conf.d]$chmod o+r /var/log/syslog
[root@elk2-ljk conf.d]$chmod o+r /var/log/auth.log

# 2. 编写配置文件,采集多个日志文件,输出到不同的文件
[root@elk2-ljk conf.d]$vim system-log.conf
input {
file {
type => "syslog"
path => "/var/log/syslog"
start_position => "end"
stat_interval => 5
}
file {
type => "authlog"
path => "/var/log/auth.log"
start_position => "end"
stat_interval => 5
}
}
output {
if [type] == "syslog" {
file {
path => "/tmp/%{type}.%{+yyyy.MM.dd}"
}
}
if [type] == "authlog" {
file {
path => "/tmp/%{type}.%{+yyyy.MM.dd}"
}
}
}

# 3. 检查配置文件是否合法
[root@elk2-ljk conf.d]$/usr/share/logstash/bin/logstash -f ./system-log.conf -t

# 4. 重启logstash.service
[root@elk2-ljk conf.d]$systemctl restart logstash.service

# 5. 观察输出文件
[root@elk2-ljk conf.d]$tail -f /tmp/syslog.2021.03.05
...
[root@elk2-ljk conf.d]$tail -f /tmp/authlog.2021.03.05
...

时间格式参考:http://joda-time.sourceforge.net/apidocs/org/joda/time/format/DateTimeFormat.html

输出到 elasticsearch

elasticsearch 输出插件至少指定 hostsindexhosts可以指定 hosts 列表

1
2
3
4
5
6
7
8
9
10
11
12
13
14
15
input {
file {
type => "syslog"
path => "/var/log/syslog"
start_position => "end"
stat_interval => 3
}
}

output {
elasticsearch {
hosts => ["10.0.1.121:9200"]
index => "mytest-%{type}-%{+xxxx.ww}"
}
}

kibana

开源的数据分析和可视化平台,可以 对 Elasticsearch 索引中的数据进行搜索、查看、交互操作,可以很方便的利用图表、表格及地图对数据进行多元化的分析和呈现

安装

1
2
3
4
5
6
7
8
9
10
11
[root@elk1-ljk src]$tar zxf kibana-7.11.1-linux-x86_64.tar.gz
[root@elk1-ljk src]$mv kibana-7.11.1-linux-x86_64 /usr/local/kibana
[root@elk1-ljk src]$cd /usr/local/kibana
[root@elk1-ljk kibana]$grep '^[a-Z]' config/kibana.yml # 修改以下配置项
server.port: 5601
server.host: "10.0.1.121"
elasticsearch.hosts: ["http://10.0.1.121:9200"]
i18n.locale: "zh-CN"

[root@elk1-ljk kibana]$./bin/kibana --allow-root # 启动
# nohup ./bin/kibana --allow-root >/dev/null 2>&1 & # 后台启动

因为笔记本的性能问题,将 elasticsearch 集群缩减为 elasticsearch 单节点,这导致 kibana 无法连接到 elasticsearch,启动失败。解决办法:将 elasticsearch 的数据目录清空,然后重启

1
2
3
4
5
6
[root@elk1-ljk data]$systemctl stop elasticsearch.service  # 停止elasticsearch
[root@elk1-ljk data]$ls /data/elasticsearch/
data logs
[root@elk1-ljk data]$rm -rf /data/elasticsearch/* # 清空数据目录
[root@elk1-ljk data]$systemctl start elasticsearch.service # 重新启动elasticsearch
[root@elk1-ljk kibana]$./bin/kibana --allow-root # 再次启动kibana

查看状态

kibana 画图功能详解

添加一个仪表盘

Beats

https://www.elastic.co/cn/beats/

logstash 基于 java,资源消耗很大,容器等场景,大多跑的都是轻量级的服务,没有必要安装 logstash,就可以用 beats 代替 logstash 做日志收集,beats 基于 go,性能更强,资源占用更低,但是功能也相对简单

beats 是一个系列,具体包含以下类型的采集器:

  • filebeat:轻量型日志采集器,最常用
  • metricbeat:轻量型指标采集器,获取系统级的 CPU 使用率、内存、文件系统、磁盘 IO 和网络 IO 统计数据,还可针对系统上的每个进程获得与 top 命令类似的统计数据
  • heartbeat:面向运行状态监测的轻量型采集器,通过 ICMP、TCP 和 HTTP 进行 ping 检测主机、网站可用性
  • packetbeat:轻量型网络数据采集器
  • winlogbeat:轻量型 Windows 事件日志采集器
  • auditbeat:轻量型审计日志采集器
  • functionbeat:面向云端数据的无服务器采集器

除了 filebeat,其他的 beat 可以用 zabbix 替代

filebeat

官方文档:https://www.elastic.co/guide/en/beats/filebeat/current/index.html

配置:只需要配置 input 和 output

1
2
3
4
5
6
7
8
9
10
11
12
13
14
15
16
17
18
19
20
21
22
23
24
25
26
27
28
29
30
31
32
33
34
35
36
37
38
39
40
41
42
43
44
45
46
47
48
49
50
51
52
53
54
55
56
57
58
59
60
61
62
63
64
65
66
67
68
69
70
71
72
73
74
75
76
77
78
79
80
81
82
83
84
85
86
87
88
89
90
91
92
93
94
95
96
97
98
99
100
101
102
103
104
# ============================== Filebeat inputs ==================
filebeat.inputs:

- type: log # 日志type
enabled: false # 是否启动
paths: # 被采集日志,可以写多个
- /var/log/*.log
exclude_lines: ['^DBG'] # 不采集日志中的哪些行
include_lines: ['^ERR', '^WARN'] # 只采集日志中的哪些行
exclude_files: ['.gz$'] # 从paths的匹配中排除哪些文件
fields: # 自定义字段,可以定义多个,后面用来做条件判断
level: debug
review: 1
multiline.pattern: ^\[ # 合并多行,匹配规则
multiline.negate: false # 合并多行,配皮成功或失败执行合并
multiline.match: after # 合并多行,向前合并还是向后合并

# ============================== Filebeat modules ==============================

filebeat.config.modules:
path: ${path.config}/modules.d/*.yml
reload.enabled: false
reload.period: 10s

# ======================= Elasticsearch template setting =======================

setup.template.settings:
index.number_of_shards: 1
index.codec: best_compression
_source.enabled: false

# ================================== General ===================================

#name:
#tags: ["service-X", "web-tier"]
#fields:
# env: staging

# ================================= Dashboards =================================

#setup.dashboards.enabled: false
#setup.dashboards.url:

# =================================== Kibana ===================================

setup.kibana:
#host: "localhost:5601"
#space.id:

# =============================== Elastic Cloud ================================

#cloud.id:
#cloud.auth:

# ================================== Outputs ===================================
# 不同的output,有不同的配置,但是没有条件判断功能,无法根据不同的input使用不用的output
# ---------------------------- Elasticsearch Output ----------------------------
#output.elasticsearch:
#hosts: ["localhost:9200"]
#protocol: "https"
#api_key: "id:api_key"
#username: "elastic"
#password: "changeme"

# ------------------------------ Logstash Output -------------------------------
#output.logstash:
#hosts: ["localhost:5044"]
#ssl.certificate_authorities: ["/etc/pki/root/ca.pem"]
#ssl.certificate: "/etc/pki/client/cert.pem"
#ssl.key: "/etc/pki/client/cert.key"

# ================================= Processors =================================
processors:
- add_host_metadata:
when.not.contains.tags: forwarded
- add_cloud_metadata: ~
- add_docker_metadata: ~
- add_kubernetes_metadata: ~

# ================================== Logging ===================================

#logging.level: debug
#logging.selectors: ["*"]

# ============================= X-Pack Monitoring ==============================

#monitoring.enabled: false
#monitoring.cluster_uuid:
#monitoring.elasticsearch:

# ============================== Instrumentation ===============================

#instrumentation:
#enabled: false
#environment: ""
#hosts:
# - http://localhost:8200
#api_key:
#secret_token:

# ================================= Migration ==================================

#migration.6_to_7.enabled: true

示例:

1

metricbeat

heartbeat

配套 B 站教程:https://www.bilibili.com/video/BV1Be4y167n9

Elastic Stack 在企业的常见架构

Elastic Stack 分布式⽇志系统概述

集群基础环境初始化

1.准备虚拟机

IP 地址 主机名 CPU 配置 内存配置 磁盘配置 角色说明
10.0.0.101 elk101.oldboyedu.com 2 core 4G 20G+ ES node
10.0.0.102 elk102.oldboyedu.com 2 core 4G 20G+ ES node
10.0.0.103 elk103.oldboyedu.com 2 core 4G 20G+ ES node

2.修改软件源

参考链接:https://mirrors.tuna.tsinghua.edu.cn/help/centos/

1
2
3
4
5
6
7
8
9
10
11
# 对于 CentOS 7
sudo sed -e 's|^mirrorlist=|#mirrorlist=|g' \
-e 's|^#baseurl=http://mirror.centos.org|baseurl=https://mirrors.tuna.tsinghua.edu.cn|g' \
-i.bak \
/etc/yum.repos.d/CentOS-*.repo

# 对于 CentOS 8
sudo sed -e 's|^mirrorlist=|#mirrorlist=|g' \
-e 's|^#baseurl=http://mirror.centos.org/$contentdir|baseurl=https://mirrors.tuna.tsinghua.edu.cn/centos|g' \
-i.bak \
/etc/yum.repos.d/CentOS-*.repo

3.修改终端颜色

1
2
3
4
cat <<EOF >> ~/.bashrc
PS1='[\[\e[34;1m\]\u@\[\e[0m\]\[\e[32;1m\]\H\[\e[0m\]\[\e[31;1m\] \W\[\e[0m\]]# '
EOF
source ~/.bashrc

4.修改 sshd 服务优化

1
2
3
4
sed -ri 's@^#UseDNS yes@UseDNS no@g' /etc/ssh/sshd_config
sed -ri 's#^GSSAPIAuthentication yes#GSSAPIAuthentication no#g' /etc/ssh/sshd_config
grep ^UseDNS /etc/ssh/sshd_config
grep ^GSSAPIAuthentication /etc/ssh/sshd_config

5.关闭防⽕墙

1
2
systemctl disable --now firewalld && systemctl is-enabled firewalld
systemctl status firewalld

6.禁⽤ selinux

1
2
3
4
sed -ri 's#(SELINUX=)enforcing#\1disabled#' /etc/selinux/config
grep ^SELINUX= /etc/selinux/config
setenforce 0
getenforce

7.配置集群免密登录及同步脚本

1
2
3
4
5
6
7
8
9
10
11
12
13
14
15
16
17
18
19
20
21
22
23
24
25
26
27
28
29
30
31
32
33
34
35
36
37
38
39
40
41
42
43
44
45
46
47
48
49
50
51
52
53
54
55
56
57
58
# 1.修改主机列表
cat >>/etc/hosts <<EOF
10.0.0.101 elk101.oldboyedu.com
10.0.0.102 elk102.oldboyedu.com
10.0.0.103 elk103.oldboyedu.com
EOF
# 2.elk101节点上⽣成密钥对
ssh-keygen -t rsa -P '' -f ~/.ssh/id_rsa -q
# 3.elk101配置所有集群节点的免密登录
for ((host_id = 101; host_id <= 103; host_id++)); do
ssh-copy-id
elk${host_id}.oldboyedu.com
done
# 4.链接测试
ssh 'elk101.oldboyedu.com'
ssh 'elk102.oldboyedu.com'
ssh 'elk103.oldboyedu.com'
# 5.所有节点安装rsync数据同步⼯具
yum -y install rsync
# 6.编写同步脚本
vim /usr/local/sbin/data_rsync.sh
# 将下⾯的内容拷⻉到该⽂件即可
#!/bin/bash
# Auther: Jason Yin
if
[ $# -ne 1 ]
then
echo "Usage: $0 /path/to/file(绝对路径)"
exit
fi
# 判断⽂件是否存在
if [ ! -e $1 ]; then
echo "[ $1 ] dir or file not find!"
exit
fi
# 获取⽗路径
fullpath=$(dirname $1)
# 获取⼦路径
basename=$(basename $1)
# 进⼊到⽗路径
cd $fullpath
for ((host_id = 102; host_id <= 103; host_id++)); do
# 使得终端输出变为绿⾊
tput setaf 2
echo ===== rsyncing elk${host_id}.oldboyedu.com: $basename =====
# 使得终端恢复原来的颜⾊
tput setaf 7
# 将数据同步到其他两个节点
rsync -az $basename
$(whoami)@elk${host_id}.oldboyedu.com:$fullpath
if [ $? -eq 0 ]; then
echo "命令执⾏成功!"
fi
done


# 7.给脚本授权
chmod +x /usr/local/sbin/data_rsync.sh

8.集群时间同步

1
2
3
4
5
6
7
8
9
10
11
12
13
14
15
16
17
18
19
20
# 1.安装常⽤的Linux⼯具,您可以⾃定义哈。
yum -y install vim net-tools
# 2.安装chrony服务
yum -y install ntpdate chrony
# 3.修改chrony服务配置⽂件
vim /etc/chrony.conf
#...
# 注释官⽅的时间服务器,换成国内的时间服务器即可
server ntp.aliyun.com iburst
server ntp1.aliyun.com iburst
server ntp2.aliyun.com iburst
server ntp3.aliyun.com iburst
server ntp4.aliyun.com iburst
server ntp5.aliyun.com iburst
#...
# 4.配置chronyd的开机⾃启动
systemctl enable --now chronyd
systemctl restart chronyd
# 5.查看服务
systemctl status chronyd

Elasticsearch 单点部署

1.下载

https://www.elastic.co/cn/downloads/elasticsearch

2.单点部署 elasticsearch

1
2
3
4
5
6
7
8
9
10
11
12
13
14
15
16
17
18
19
20
21
# 1.安装服务
$ yum -y localinstal elasticsearch-7.17.3-x86_64.rpm
# 2.修改配置⽂件
$ egrep -v "^#|^$" /etc/elasticsearch/elasticsearch.yml
cluster.name: oldboyedu-elk
node.name: oldboyedu-elk103
path.data: /var/lib/elasticsearch
path.logs: /var/log/elasticsearch
network.host: 10.0.0.103
discovery.seed_hosts: ["10.0.0.103"]

# 相关参数说明:
# cluster.name: 集群名称,若不指定,则默认是"elasticsearch",⽇志⽂件的前缀也是集群名称。
# node.name: 指定节点的名称,可以⾃定义,推荐使⽤当前的主机名,要求集群唯⼀。
# path.data: 数据路径。
# path.logs: ⽇志路径
# network.host: ES服务监听的IP地址
# discovery.seed_hosts: 服务发现的主机列表,对于单点部署⽽⾔,主机列表和"network.host"字段配置相同即可。

# 3.启动服务
$ systemctl start elasticsearch.service

Elasticsearch 分布式集群部署

1.elk101 修改配置文件

1
2
3
4
5
6
7
8
9
10
11
12
13
egrep -v "^$|^#" /etc/elasticsearch/elasticsearch.yml
...
cluster.name: oldboyedu-elk
node.name: elk101
path.data: /var/lib/elasticsearch
path.logs: /var/log/elasticsearch
network.host: 0.0.0.0
discovery.seed_hosts: ["elk101","elk102","elk103"]
cluster.initial_master_nodes: ["elk101","elk102","elk103"]


# 温馨提示:
# "node.name"各个节点配置要区分清楚,建议写对应的主机名称。

2.同步配置⽂件到集群的其他节点

1
2
3
4
5
6
7
8
9
10
11
12
# 1.elk101同步配置⽂件到集群的其他节点
data_rsync.sh /etc/elasticsearch/elasticsearch.yml

# 2.elk102节点配置
vim /etc/elasticsearch/elasticsearch.yml
...
node.name: elk102

# 3.elk103节点配置
vim /etc/elasticsearch/elasticsearch.yml
...
node.name: elk103

3.所有节点删除之前的临时数据

1
2
3
pkill java
rm -rf /var/{lib,log}/elasticsearch/* /tmp/*
ll /var/{lib,log}/elasticsearch/ /tmp/

4.所有节点启动服务

1
2
3
4
5
# 1.所有节点启动服务
systemctl start elasticsearch

# 2.启动过程中建议查看⽇志
tail -100f /var/log/elasticsearch/oldboyedu-elk.log

5.验证集群是否正常

1
curl elk103:9200/_cat/nodes?v

部署 kibana 服务

1.本地安装 kibana

1
yum -y localinstall kibana-7.17.3-x86_64.rpm

2.修改 kibana 的配置⽂件

1
2
3
4
5
6
vim /etc/kibana/kibana.yml
...
server.host: "10.0.0.101"
server.name: "oldboyedu-kibana-server"
elasticsearch.hosts: ["http://10.0.0.101:9200","http://10.0.0.102:9200","http://10.0.0.103:9200"]
i18n.locale: "zh-CN"

3.启动 kibana 服务

1
2
systemctl enable --now kibana
systemctl status kibana

4.访问 kibana 的 webUI

略。。。

filebeat 部署及基础使用

1
2
3
4
5
6
7
8
9
10
11
12
13
14
15
16
17
18
19
20
21
22
23
24
25
26
27
28
29
30
31
32
33
34
35
36
37
38
39
$ ./filebeat --help
Usage:
filebeat [flags]
filebeat [command]

Available Commands:
export Export current config or index template
generate Generate Filebeat modules, filesets and fields.yml
help Help about any command
keystore Manage secrets keystore
modules Manage configured modules
run Run filebeat
setup Setup index template, dashboards and ML jobs
test Test config
version Show current version info

Flags:
-E, --E setting=value Configuration overwrite
-M, --M setting=value Module configuration overwrite
-N, --N Disable actual publishing for testing
-c, --c string Configuration file, relative to path.config (default "filebeat.yml")
--cpuprofile string Write cpu profile to file
-d, --d string Enable certain debug selectors
-e, --e Log to stderr and disable syslog/file output
--environment environmentVar set environment being ran in (default default)
-h, --help help for filebeat
--httpprof string Start pprof http server
--memprofile string Write memory profile to this file
--modules string List of enabled modules (comma separated)
--once Run filebeat only once until all harvesters reach EOF
--path.config string Configuration path
--path.data string Data path
--path.home string Home path
--path.logs string Logs path
--plugin pluginList Load additional plugins
--strict.perms Strict permission checking on config files (default true)
-v, --v Log at INFO level

Use "filebeat [command] --help" for more information about a command.

1.部署 filebeat 环境

1
2
3
yum -y localinstall filebeat-7.17.3-x86_64.rpm

# 温馨提示: elk102节点操作

2.简单测试

2.1 编写配置文件

1
2
3
4
5
6
7
mkdir /etc/filebeat/config
cat > /etc/filebeat/config/01-stdin-to-console.yml <<EOF
filebeat.inputs: # 指定输⼊的类型
- type: stdin # 指定输⼊的类型为"stdin",表示标准输⼊
output.console: # 指定输出的类型
pretty: true # 打印漂亮的格式
EOF

2.2 运行 filebeat 实例

1
2
$ filebeat -e -c /etc/filebeat/config/01-stdin-to-console.yml
...

2.3 测试

1
2
3
4
5
6
7
8
9
10
11
12
13
14
15
16
17
18
19
20
21
22
23
24
25
26
27
28
29
30
31
32
33
34
 ...
hello word
{
"@timestamp": "2022-11-04T05:47:24.880Z",
"@metadata": {
"beat": "filebeat",
"type": "_doc",
"version": "8.4.3"
},
"ecs": {
"version": "8.0.0"
},
"host": {
"name": "lujinkai-pc"
},
"log": {
"file": {
"path": ""
},
"offset": 0
},
"message": "hello word",
"input": {
"type": "stdin"
},
"agent": {
"type": "filebeat",
"version": "8.4.3",
"ephemeral_id": "8a43c946-9a6d-43dc-8a79-4fe673f7882d",
"id": "af9266b6-6d99-48d2-abc2-acea45ef1c61",
"name": "lujinkai-pc"
}
}
...

3.input 的 log 类型

1
2
3
4
5
6
filebeat.inputs:
- type: log
paths:
- /tmp/test.log
output.console:
pretty: true

4.input 的通配符案例

1
2
3
4
5
6
7
filebeat.inputs:
- type: log
paths:
- /tmp/test.log
- /tmp/*.txt
output.console:
pretty: true

5.input 的通用字段案例

1
2
3
4
5
6
7
8
9
10
11
12
13
14
15
16
17
18
19
20
21
22
23
24
25
26
27
28
filebeat.inputs:
- type: log
# 是否启动当前的输⼊类型,默认值为true
enabled: true
# 指定数据路径
paths:
- /tmp/test.log
- /tmp/*.txt
# 给当前的输⼊类型搭上标签
tags: ["oldboyedu-linux80", "容器运维", "DBA运维", "SRE运维⼯程师"]
# ⾃定义字段
fields:
school: "北京昌平区沙河镇"
class: "linux80"
- type: log
enabled: true
paths:
- /tmp/test/*/*.log
tags: ["oldboyedu-python", "云原⽣开发"]
fields:
name: "oldboy"
hobby: "linux,抖⾳"
# 将⾃定义字段的key-value放到顶级字段.
# 默认值为false,会将数据放在⼀个叫"fields"字段的下⾯.
fields_under_root: true

output.console:
pretty: true

6.日志过滤案例

1
2
3
4
5
6
7
8
9
10
11
12
13
filebeat.inputs:
- type: log
enabled: true
paths:
- /tmp/test/*.log
# 注意,⿊⽩名单均⽀持通配符,⽣产环节中不建议同时使⽤,
# 指定⽩名单,包含指定的内容才会采集,且区分⼤⼩写!
include_lines: ["^ERR", "^WARN", "oldboyedu"]
# 指定⿊名单,排除指定的内容
exclude_lines: ["^DBG", "linux", "oldboyedu"]

output.console:
pretty: true

7.将数据写入 es 案例

1
2
3
4
5
6
7
8
9
10
11
12
13
14
15
16
17
18
19
20
21
22
filebeat.inputs:
- type: log
enabled: true
paths:
- /tmp/test.log
- /tmp/*.txt
tags: ["oldboyedu-linux80", "容器运维", "DBA运维", "SRE运维⼯程师"]
fields:
school: "北京昌平区沙河镇"
class: "linux80"
- type: log
enabled: true
paths:
- /tmp/test/*/*.log
tags: ["oldboyedu-python", "云原⽣开发"]
fields:
name: "oldboy"
hobby: "linux,抖⾳"
fields_under_root: true

output.elasticsearch:
hosts: ["http://10.0.0.101:9200", "http://10.0.0.102:9200", "http://10.0.0.103:9200"]

8.自定义 es 索引名称

1
2
3
4
5
6
7
8
9
10
11
12
13
14
15
16
17
18
19
20
21
22
23
24
25
26
27
28
filebeat.inputs:
- type: log
enabled: true
paths:
- /tmp/test.log
- /tmp/*.txt
tags: ["oldboyedu-linux80", "容器运维", "DBA运维", "SRE运维⼯程师"]
fields:
school: "北京昌平区沙河镇"
class: "linux80"
- type: log
enabled: true
paths:
- /tmp/test/*/*.log
tags: ["oldboyedu-python", "云原⽣开发"]
fields:
name: "oldboy"
hobby: "linux,抖⾳"
fields_under_root: true

output.elasticsearch:
enabled: true
hosts: ["http://10.0.0.101:9200", "http://10.0.0.102:9200", "http://10.0.0.103:9200"]
index: "oldboyedu-linux-elk-%{+yyyy.MM.dd}"

setup.ilm.enabled: false # 禁⽤索引⽣命周期管理
setup.template.name: "oldboyedu-linux" # 设置索引模板的名称
setup.template.pattern: "oldboyedu-linux*" # 设置索引模板的匹配模式

9.多个索引写入案例

1
2
3
4
5
6
7
8
9
10
11
12
13
14
15
16
17
18
19
20
21
22
23
24
25
26
27
28
29
30
31
32
33
34
35
filebeat.inputs:
- type: log
enabled: true
paths:
- /tmp/test.log
- /tmp/*.txt
tags: ["oldboyedu-linux80", "容器运维", "DBA运维", "SRE运维⼯程师"]
fields:
school: "北京昌平区沙河镇"
class: "linux80"
- type: log
enabled: true
paths:
- /tmp/test/*/*.log
tags: ["oldboyedu-python", "云原⽣开发"]
fields:
name: "oldboy"
hobby: "linux,抖⾳"
fields_under_root: true
output.elasticsearch:
enabled: true
hosts: ["http://10.0.0.101:9200", "http://10.0.0.102:9200", "http://10.0.0.103:9200"]
# index: "oldboyedu-linux-elk-%{+yyyy.MM.dd}"
indices:
- index: "oldboyedu-linux-elk-%{+yyyy.MM.dd}"
# 匹配指定字段包含的内容
when.contains:
tags: "oldboyedu-linux80"
- index: "oldboyedu-linux-python-%{+yyyy.MM.dd}"
when.contains:
tags: "oldboyedu-python"

setup.ilm.enabled: false # 禁⽤索引⽣命周期管理
setup.template.name: "oldboyedu-linux" # 设置索引模板的名称
setup.template.pattern: "oldboyedu-linux*" # 设置索引模板的匹配模式

10.自定义分片和副本案例

1
2
3
4
5
6
7
8
9
10
11
12
13
14
15
16
17
18
19
20
21
22
23
24
25
26
27
28
29
30
31
32
33
34
35
36
37
38
39
40
41
filebeat.inputs:
- type: log
enabled: true
paths:
- /tmp/test.log
- /tmp/*.txt
tags: ["oldboyedu-linux80", "容器运维", "DBA运维", "SRE运维⼯程师"]
fields:
school: "北京昌平区沙河镇"
class: "linux80"
- type: log
enabled: true
paths:
- /tmp/test/*/*.log
tags: ["oldboyedu-python", "云原⽣开发"]
fields:
name: "oldboy"
hobby: "linux,抖⾳"
fields_under_root: true

output.elasticsearch:
enabled: true
hosts: ["http://10.0.0.101:9200", "http://10.0.0.102:9200", "http://10.0.0.103:9200"]
# index: "oldboyedu-linux-elk-%{+yyyy.MM.dd}"
indices:
- index: "oldboyedu-linux-elk-%{+yyyy.MM.dd}"
# 匹配指定字段包含的内容
when.contains:
tags: "oldboyedu-linux80"
- index: "oldboyedu-linux-python-%{+yyyy.MM.dd}"
when.contains:
tags: "oldboyedu-python"


setup.ilm.enabled: false # 禁⽤索引⽣命周期管理
setup.template.name: "oldboyedu-linux" # 设置索引模板的名称
setup.template.pattern: "oldboyedu-linux*" # 设置索引模板的匹配模式
setup.template.overwrite: false # 覆盖已有的索引模板
setup.template.settings: # 配置索引模板
index.number_of_shards: 3 # 设置分⽚数量
index.number_of_replicas: 2 # 设置副本数量,要求⼩于集群的数量

11.filebeat 实现日志聚合到本地

1
2
3
4
5
6
7
8
9
10
filebeat.inputs:
- type: tcp
host: "0.0.0.0:9000"

output.file:
path: "/tmp/filebeat"
filename: oldboyedu-linux80
rotate_every_kb: 102400 # 指定⽂件的滚动⼤⼩,默认值为20MB
number_of_files: 300 # 指定保存的⽂件个数,默认是7个,有效值为2-1024个
permissions: 0600 # 指定⽂件的权限,默认权限是0600

12.filebeat 实现日志聚合到 ES 集群

1
2
3
4
5
6
7
8
9
10
11
12
13
14
15
16
17
18
19
20
21
22
23
24
25
26
filebeat.inputs:
- type: tcp
host: "0.0.0.0:9000"
tags: ["aaa"]
- type: tcp
host: "0.0.0.0:8000"
tags: ["bbb"]

output.elasticsearch:
enabled: true
hosts: ["http://10.0.0.101:9200", "http://10.0.0.102:9200", "http://10.0.0.103:9200"]
indices:
- index: "oldboyedu-linux80-elk-aaa-%{+yyyy.MM.dd}"
when.contains:
tags: "aaa"
- index: "oldboyedu-linux80-elk-bbb-%{+yyyy.MM.dd}"
when.contains:
tags: "bbb"

setup.ilm.enabled: false
setup.template.name: "oldboyedu-linux80-elk"
setup.template.pattern: "oldboyedu-linux80-elk*"
setup.template.overwrite: true
setup.template.settings:
index.number_of_shards: 3
index.number_of_replicas: 0

EFK 架构企业级实战案例

1.部署 nginx 服务

1
2
3
4
5
6
7
8
9
10
11
12
13
14
15
16
17
18
19
20
21
# 1.配置nginx的软件源
cat >/etc/yum.repos.d/nginx.repo <<EOF
[nginx-stable]
name=nginx stable repo
baseurl=http://nginx.org/packages/centos/$releasever/$basearch/
gpgcheck=1
enabled=1
gpgkey=https://nginx.org/keys/nginx_signing.key
module_hotfixes=true
[nginx-mainline]
name=nginx mainline repo
baseurl=http://nginx.org/packages/mainline/centos/$releasever/$basearch/
gpgcheck=1
enabled=0
gpgkey=https://nginx.org/keys/nginx_signing.key
module_hotfixes=true
EOF
# 2.安装nginx服务
yum -y install nginx
# 3.启动nginx服务
systemctl start nginx

2.基于 log 类型收集 nginx 原生日志

1
2
3
4
5
6
7
8
9
10
11
12
13
14
15
16
17
18
19
filebeat.inputs:
- type: log
enabled: true
paths:
- /var/log/nginx/access.log*
tags: ["access"]

output.elasticsearch:
enabled: true
hosts: ["http://10.0.0.101:9200", "http://10.0.0.102:9200", "http://10.0.0.103:9200"]
index: "oldboyedu-linux-nginx-%{+yyyy.MM.dd}"

setup.ilm.enabled: false # 禁⽤索引⽣命周期管理
setup.template.name: "oldboyedu-linux" # 设置索引模板的名称
setup.template.pattern: "oldboyedu-linux*" # 设置索引模板的匹配模式
setup.template.overwrite: true # 覆盖已有的索引模板,如果为true,则会直接覆盖现有的索引模板,如果为false则不覆盖!
setup.template.settings: # 配置索引模板
index.number_of_shards: 3 # 设置分⽚数量
index.number_of_replicas: 0 # 设置副本数量,要求⼩于集群的数量

3.基于 log 类型收集 nginx 的 json 日志

1
2
3
4
5
6
7
8
9
10
11
12
13
14
15
16
17
18
19
20
21
22
23
24
25
26
27
28
29
30
31
32
33
34
35
36
37
38
39
40
41
42
43
44
# 1. 修改nginx的源⽇志格式
vim /etc/nginx/nginx.conf
...
log_format oldboyedu_nginx_json '{"@timestamp":"$time_iso8601",'
'"host":"$server_addr",'
'"clientip":"$remote_addr",'
'"SendBytes":$body_bytes_sent,'
'"responsetime":$request_time,'
'"upstreamtime":"$upstream_response_time",'
'"upstreamhost":"$upstream_addr",'
'"http_host":"$host",'
'"uri":"$uri",'
'"domain":"$host",'
'"xff":"$http_x_forwarded_for",'
'"referer":"$http_referer",'
'"tcp_xff":"$proxy_protocol_addr",'
'"http_user_agent":"$http_user_agent",'
'"status":"$status"}';

access_log /var/log/nginx/access.log oldboyedu_nginx_json;
# 2.检查nginx的配置⽂件语法并重启nginx服务
nginx -t
systemctl restart nginx
# 3.定义配置⽂件
filebeat.inputs:
- type: log
enabled: true
paths:
- /var/log/nginx/access.log*
tags: ["access"]
json.keys_under_root: true # 以JSON格式解析message字段的内容

output.elasticsearch:
enabled: true
hosts: ["http://10.0.0.101:9200","http://10.0.0.102:9200","http://10.0.0.103:9200"]
index: "oldboyedu-linux-nginx-access-%{+yyyy.MM.dd}"

setup.ilm.enabled: false # 禁⽤索引⽣命周期管理
setup.template.name: "oldboyedu-linux" # 设置索引模板的名称
setup.template.pattern: "oldboyedu-linux*" # 设置索引模板的匹配模式
setup.template.overwrite: true # 覆盖已有的索引模板,如果为true,则会直接覆盖现有的索引模板,如果为false则不覆盖!
setup.template.settings: # 配置索引模板
index.number_of_shards: 3 # 设置分⽚数量
index.number_of_replicas: 0 # 设置副本数量,要求⼩于集群的数量

4.基于 modules 采集 nginx 日志文件

模块的基本使用

1
2
3
4
5
6
# 查看模块
$ filebeat modules list
# 启动模块
$ filebeat modules enable nginx tomcat
# 禁⽤模块
$ filebeat modules disable nginx tomcat

filebeat 配置⽂件(需要启⽤ nginx 模块)

1
2
3
4
5
6
7
8
9
10
11
12
filebeat.config.modules:
# 指定模块的配置⽂件路径,如果是yum⽅式安装,在7.17.3版本中不能使⽤如下的默认值。
# path: ${path.config}/modules.d/*.yml
# 经过实际测试,推荐⼤家使⽤如下的配置,此处写绝对路径即可!⽽对于⼆进制部署⽆需做此操作.
path: /etc/filebeat/modules.d/*.yml
# 开启热加载功能
reload.enabled: true

output.elasticsearch:
enabled: true
hosts: ["http://10.0.0.101:9200", "http://10.0.0.102:9200", "http://10.0.0.103:9200"]
index: "oldboyedu-linux-nginx-access-%{+yyyy.MM.dd}"

/etc/filebeat/modules.d/nginx.yml ⽂件内容:

1
2
3
4
5
6
7
8
9
- module: nginx
access:
enabled: true
var.paths: ["/var/log/nginx/access.log*"]
error:
enabled: false
var.paths: ["/var/log/nginx/error.log"]
ingress_controller:
enabled: false

5.基于 modules 采集 tomcat 日志文件

1
2
3
4
5
6
7
8
9
10
11
12
13
14
15
16
17
18
19
20
21
22
23
24
25
26
27
28
29
30
31
32
33
34
35
36
37
38
39
40
41
42
43
44
45
46
47
48
49
50
51
# 1.部署tomcat服务
# 1.1.解压tomcat软件包
tar xf apache-tomcat-10.0.20.tar.gz -C /oldboyedu/softwares/
# 1.2.创建符号链接
cd /oldboyedu/softwares/ && ln -sv apache-tomcat-10.0.20 tomcat
# 1.3.配置环境变量
vim /etc/profile.d/elk.sh
...
export JAVA_HOME=/usr/share/elasticsearch/jdk
export TOMCAT_HOME=/oldboyedu/softwares/tomcat
export PATH=$PATH:$TOMCAT_HOME/bin:$JAVA_HOME/bin
# 1.4.使得环境变量⽣效
source /etc/profile.d/elk.sh
# 1.5.启动服务
catalina.sh start

# 2.启⽤tomcat的模块管理
filebeat -c ~/config/11-nginx-to-es.yml modules disable nginx
filebeat -c ~/config/11-nginx-to-es.yml modules enable tomcat
filebeat -c ~/config/11-nginx-to-es.yml modules list

# 3.filebeat配置⽂件
filebeat.config.modules:
# 指定模块的配置⽂件路径,如果是yum⽅式安装,在7.17.3版本中不能使⽤如下的默认值。
# path: ${path.config}/modules.d/*.yml
# 经过实际测试,推荐⼤家使⽤如下的配置,此处写绝对路径即可!⽽对于⼆进制部署⽆需做此操作.
path: /etc/filebeat/modules.d/*.yml
# 开启热加载功能
reload.enabled: true

output.elasticsearch:
enabled: true
hosts: ["http://10.0.0.101:9200","http://10.0.0.102:9200","http://10.0.0.103:9200"]
index: "oldboyedu-linux-tomcat-access-%{+yyyy.MM.dd}"

setup.ilm.enabled: false # 禁⽤索引⽣命周期管理
setup.template.name: "oldboyedu-linux" # 设置索引模板的名称
setup.template.pattern: "oldboyedu-linux*" # 设置索引模板的匹配模式
setup.template.overwrite: true # 覆盖已有的索引模板,如果为true,则会直接覆盖现有的索引模板,如果为false则不覆盖!
setup.template.settings: # 配置索引模板
index.number_of_shards: 3 # 设置分⽚数量
index.number_of_replicas: 0 # 设置副本数量,要求⼩于集群的数量

# 4./etc/filebeat/modules.d/tomcat.yml⽂件内容
- module: tomcat
log:
enabled: true
# 指定输⼊的类型是⽂件,默认是监听udp端⼝哟~
var.input: file
var.paths:
- "/oldboyedu/softwares/apache-tomcat-10.0.20/logs/localhost_access_log.2022-05-11.txt"

6.基于 log 类型收集 tomcat 的原生日志

1
2
3
4
5
6
7
8
9
10
11
12
13
14
15
16
17
18
filebeat.inputs:
- type: log
enabled: true
paths:
- /oldboyedu/softwares/apache-tomcat-10.0.20/logs/*.txt

output.elasticsearch:
enabled: true
hosts: ["http://10.0.0.101:9200", "http://10.0.0.102:9200", "http://10.0.0.103:9200"]
index: "oldboyedu-linux-tomcat-access-%{+yyyy.MM.dd}"

setup.ilm.enabled: false # 禁⽤索引⽣命周期管理
setup.template.name: "oldboyedu-linux" # 设置索引模板的名称
setup.template.pattern: "oldboyedu-linux*" # 设置索引模板的匹配模式
setup.template.overwrite: true # 覆盖已有的索引模板,如果为true,则会直接覆盖现有的索引模板,如果为false则不覆盖!
setup.template.settings: # 配置索引模板
index.number_of_shards: 3 # 设置分⽚数量
index.number_of_replicas: 0 # 设置副本数量,要求⼩于集群的数量

7.基于 log 类型收集 tomcat 的 json 日志

1
2
3
4
5
6
7
8
9
10
11
12
13
14
15
16
17
18
19
20
21
22
23
24
25
26
27
28
29
30
31
32
# 1.⾃定义tomcat的⽇志格式
cp /oldboyedu/softwares/apache-tomcat-10.0.20/conf/{server.xml,server.xml-`date +%F`}
# ...(切换到⾏尾修改,⼤概是在133-149之间)
<Host name="tomcat.oldboyedu.com" appBase="webapps"
unpackWARs="true" autoDeploy="true">
<Valve className="org.apache.catalina.valves.AccessLogValve"
directory="logs"
prefix="tomcat.oldboyedu.com_access_log" suffix=".txt"
pattern="{&quot;clientip&quot;:&quot;%h&quot;,&quot;ClientUser&quot;:&quot;%l&quot;,&quot;authenticated&quot;:&quot;%u&quot;,&quot;AccessTime&quot;:&quot;%t&quot;,&quot;request&quot;:&quot;%r&quot;,&quot;status&quot;:&quot;%s&quot;,&quot;SendBytes&quot;:&quot;%b&quot;,&quot;Query?string&quot;:&quot;%q&quot;,&quot;partner&quot;:&quot;%{Referer}i&quot;,&quot;http_user_agent&quot;:&quot;%{User-Agent}i&quot;}"/>
</Host>

# 2.修改filebeat的配置⽂件
filebeat.inputs:
- type: log
enabled: true
paths:
- /oldboyedu/softwares/apache-tomcat-10.0.20/logs/*.txt
# 解析message字段的json格式,并放在顶级字段中
json.keys_under_root: true

output.elasticsearch:
enabled: true
hosts: ["http://10.0.0.101:9200", "http://10.0.0.102:9200", "http://10.0.0.103:9200"]
index: "oldboyedu-linux-tomcat-access-%{+yyyy.MM.dd}"

setup.ilm.enabled: false # 禁⽤索引⽣命周期管理
setup.template.name: "oldboyedu-linux" # 设置索引模板的名称
setup.template.pattern: "oldboyedu-linux*" # 设置索引模板的匹配模式
setup.template.overwrite: true # 覆盖已有的索引模板,如果为true,则会直接覆盖现有的索引模板,如果为false则不覆盖!
setup.template.settings: # 配置索引模板
index.number_of_shards: 3 # 设置分⽚数量
index.number_of_replicas: 0 # 设置副本数量,要求⼩于集群的数量

8.多⾏匹配-收集 tomcat 的错误日志

https://www.elastic.co/guide/en/beats/filebeat/current/multiline-examples.html

multiline.match

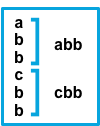
Specifies how Filebeat combines matching lines into an event. The settings are after or before. The behavior of these settings depends on what you specify for negate:

Setting for negate Setting for match Result Example pattern: ^b
false after Consecutive lines that match the pattern are appended to the previous line that doesn’t match.
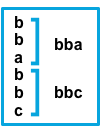
false before Consecutive lines that match the pattern are prepended to the next line that doesn’t match.
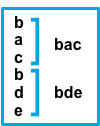
true after Consecutive lines that don’t match the pattern are appended to the previous line that does match.
true before Consecutive lines that don’t match the pattern are prepended to the next line that does match.

The after setting is equivalent to previous in Logstash, and before is equivalent to next.

1
2
3
4
5
6
7
8
9
10
11
12
13
14
15
16
17
18
19
20
21
22
23
24
25
filebeat.inputs:
- type: log
enabled: true
paths:
- /oldboyedu/softwares/apache-tomcat-10.0.20/logs/*.out
# 指定多⾏匹配的类型,可选值为"pattern","count"
multiline.type: pattern
# 指定匹配模式
multiline.pattern: '^\d{2}'
# 下⾯2个参数参考官⽅架构图即可,如上图所示。
multiline.negate: true
multiline.match: after

output.elasticsearch:
enabled: true
hosts: ["http://10.0.0.101:9200", "http://10.0.0.102:9200", "http://10.0.0.103:9200"]
index: "oldboyedu-linux-tomcat-error-%{+yyyy.MM.dd}"

setup.ilm.enabled: false # 禁⽤索引⽣命周期管理
setup.template.name: "oldboyedu-linux" # 设置索引模板的名称
setup.template.pattern: "oldboyedu-linux*" # 设置索引模板的匹配模式
setup.template.overwrite: true # 覆盖已有的索引模板,如果为true,则会直接覆盖现有的索引模板,如果为false则不覆盖!
setup.template.settings: # 配置索引模板
index.number_of_shards: 3 # 设置分⽚数量
index.number_of_replicas: 0 # 设置副本数量,要求⼩于集群的数量

9.多⾏匹配-收集 elasticsearch 的错误日志

1
2
3
4
5
6
7
8
9
10
11
12
13
14
15
16
17
18
19
20
21
22
23
24
25
filebeat.inputs:
- type: log
enabled: true
paths:
- /var/log/elasticsearch/oldboyedu-elk-2022.log*
# 指定多⾏匹配的类型,可选值为"pattern","count"
multiline.type: pattern
# 指定匹配模式
multiline.pattern: '^\['
# 下⾯2个参数参考官⽅架构图即可
multiline.negate: true
multiline.match: after

output.elasticsearch:
enabled: true
hosts: ["http://10.0.0.101:9200", "http://10.0.0.102:9200", "http://10.0.0.103:9200"]
index: "oldboyedu-linux-es-error-%{+yyyy.MM.dd}"

setup.ilm.enabled: false # 禁⽤索引⽣命周期管理
setup.template.name: "oldboyedu-linux" # 设置索引模板的名称
setup.template.pattern: "oldboyedu-linux*" # 设置索引模板的匹配模式
setup.template.overwrite: true # 覆盖已有的索引模板,如果为true,则会直接覆盖现有的索引模板,如果为false则不覆盖!
setup.template.settings: # 配置索引模板
index.number_of_shards: 3 # 设置分⽚数量
index.number_of_replicas: 0 # 设置副本数量,要求⼩于集群的数量

10.nginx 错误日志过滤

1
2
3
4
5
6
7
8
9
10
11
12
13
14
15
16
17
18
19
20
21
22
23
24
25
26
27
28
29
30
31
32
33
34
35
filebeat.inputs:
- type: log
enabled: true
paths:
- /var/log/nginx/access.log*
tags: ["access"]
# 解析message字段的json格式,并放在顶级字段中
json.keys_under_root: true
- type: log
enabled: true
paths:
- /var/log/nginx/error.log*
tags: ["error"]
include_lines: ['\[error\]']

output.elasticsearch:
enabled: true
hosts: ["http://10.0.0.101:9200", "http://10.0.0.102:9200", "http://10.0.0.103:9200"]
# index: "oldboyedu-linux-elk-%{+yyyy.MM.dd}"
indices:
- index: "oldboyedu-linux-web-nginx-access-%{+yyyy.MM.dd}"
# 匹配指定字段包含的内容
when.contains:
tags: "access"
- index: "oldboyedu-linux-web-nginx-error-%{+yyyy.MM.dd}"
when.contains:
tags: "error"

setup.ilm.enabled: false # 禁⽤索引⽣命周期管理
setup.template.name: "oldboyedu-linux" # 设置索引模板的名称
setup.template.pattern: "oldboyedu-linux*" # 设置索引模板的匹配模式
setup.template.overwrite: true # 覆盖已有的索引模板
setup.template.settings: # 配置索引模板
index.number_of_shards: 3 # 设置分⽚数量
index.number_of_replicas: 0 # 设置副本数量,要求⼩于集群的数量

11.nginx 和 tomcat 同时采集案例

1
2
3
4
5
6
7
8
9
10
11
12
13
14
15
16
17
18
19
20
21
22
23
24
25
26
27
28
29
30
31
32
33
34
35
36
37
38
39
40
41
42
43
44
45
46
47
48
49
50
51
52
53
filebeat.inputs:
- type: log
enabled: true
paths:
- /var/log/nginx/access.log*
tags: ["nginx-access"]
json.keys_under_root: true
- type: log
enabled: true
paths:
- /var/log/nginx/error.log*
tags: ["nginx-error"]
include_lines: ['\[error\]']
- type: log
enabled: true
paths:
- /oldboyedu/softwares/apache-tomcat-10.0.20/logs/*.txt
json.keys_under_root: true
tags: ["tomcat-access"]
- type: log
enabled: true
paths:
- /oldboyedu/softwares/apache-tomcat-10.0.20/logs/*.out
multiline.type: pattern
multiline.pattern: '^\d{2}'
multiline.negate: true
multiline.match: after
tags: ["tomcat-error"]

output.elasticsearch:
enabled: true
hosts: ["http://10.0.0.101:9200", "http://10.0.0.102:9200", "http://10.0.0.103:9200"]
indices:
- index: "oldboyedu-linux-web-nginx-access-%{+yyyy.MM.dd}"
when.contains:
tags: "nginx-access"
- index: "oldboyedu-linux-web-nginx-error-%{+yyyy.MM.dd}"
when.contains:
tags: "nginx-error"
- index: "oldboyedu-linux-web-tomcat-access-%{+yyyy.MM.dd}"
when.contains:
tags: "tomcat-access"
- index: "oldboyedu-linux-web-tomcat-error-%{+yyyy.MM.dd}"
when.contains:
tags: "tomcat-error"

setup.ilm.enabled: false # 禁⽤索引⽣命周期管理
setup.template.name: "oldboyedu-linux" # 设置索引模板的名称
setup.template.pattern: "oldboyedu-linux*" # 设置索引模板的匹配模式
setup.template.overwrite: true # 覆盖已有的索引模板
setup.template.settings: # 配置索引模板
index.number_of_shards: 3 # 设置分⽚数量
index.number_of_replicas: 0 # 设置副本数量,要求⼩于集群的数量

12.log 类型切换 filestream 类型注意事项

12.1.filestream 类型 json 解析配置

1
2
3
4
5
6
7
8
9
10
11
12
13
14
15
16
17
18
19
20
21
22
23
24
25
26
27
28
filebeat.inputs:
- type: filestream
enabled: true
paths:
- /var/log/nginx/access.log*
tags: ["access"]
# 对于filestream类型⽽⾔,不能直接配置json解析,⽽是需要借助解析器实现
# json.keys_under_root: true
# 综上所述,我们就需要使⽤以下的写法实现.
parsers:
# 使 Filebeat能够解码结构化为JSON消息的⽇志。
# Filebeat逐⾏处理⽇志,因此JSON解码仅在每条消息有⼀个JSON对象时才有效。
- ndjson:
# 对message字段进⾏JSON格式解析,并将key放在顶级字段。
keys_under_root: true

output.elasticsearch:
enabled: true
hosts: ["http://10.0.0.101:9200", "http://10.0.0.102:9200", "http://10.0.0.103:9200"]
index: "oldboyedu-linux-nginx-%{+yyyy.MM.dd}"

setup.ilm.enabled: false
setup.template.name: "oldboyedu-linux"
setup.template.pattern: "oldboyedu-linux*"
setup.template.overwrite: true
setup.template.settings:
index.number_of_shards: 3
index.number_of_replicas: 0

12.2.filestream 类型多行匹配

1
2
3
4
5
6
7
8
9
10
11
12
13
14
15
16
17
18
19
20
21
22
23
24
25
26
27
28
29
30
31
32
33
34
35
36
37
38
39
filebeat.inputs:
- type: filestream
enabled: true
paths:
- /oldboyedu/softwares/apache-tomcat-10.0.20/logs/*.txt
tags: ["access"]
parsers:
- ndjson:
keys_under_root: true
- type: filestream
enabled: true
paths:
- /oldboyedu/softwares/apache-tomcat-10.0.20/logs/*.out
tags: ["error"]
parsers:
- multiline:
type: pattern
pattern: '^\d{2}'
negate: true
match: after

output.elasticsearch:
enabled: true
hosts: ["http://10.0.0.101:9200", "http://10.0.0.102:9200", "http://10.0.0.103:9200"]
indices:
- index: "oldboyedu-linux-web-tomcat-access-%{+yyyy.MM.dd}"
when.contains:
tags: "access"
- index: "oldboyedu-linux-web-tomcat-error-%{+yyyy.MM.dd}"
when.contains:
tags: "error"

setup.ilm.enabled: false
setup.template.name: "oldboyedu-linux"
setup.template.pattern: "oldboyedu-linux*"
setup.template.overwrite: true
setup.template.settings:
index.number_of_shards: 3
index.number_of_replicas: 0

13.收集日志到 redis 服务

13.1.部署 redis

1
2
yum -y install epel-release
yum -y install redis

13.2.修改配置⽂件

1
2
3
4
vim /etc/redis.conf
...
bind 0.0.0.0
requirepass oldboyedu

13.3.启动 redis 服务

1
systemctl start redis

13.4.其他节点连接测试 redis 环境

1
redis-cli -a oldboyedu -h 10.0.0.101 -p 6379 --raw -n 5

13.5.将 filebeat 数据写入到 redis 环境

1
2
3
4
5
6
7
8
9
10
filebeat.inputs:
- type: tcp
host: "0.0.0.0:9000"

output.redis:
hosts: ["10.0.0.101:6379"] # 写⼊redis的主机地址
password: "oldboyedu" # 指定redis的认证⼝令
db: 5 # 指定连接数据库的编号
key: "oldboyedu-linux80-filebeat" # 指定的key值
timeout: 3 # 规定超时时间.

13.6.测试写入数据

1
2
3
4
5
6
7
# 写⼊数据:
echo 33333333333333333333| nc 10.0.0.102 9000
# 查看数据:
[root@elk103.oldboyedu.com ~]# redis-cli -a oldboyedu -h 10.0.0.101 -p
6379 --raw -n 5
.....
10.0.0.101:6379[5]> LRANGE oldboyedu-linux80-filebeat 0 -1

14.今日作业

1
2
3
4
5
6
7
8
9
10
11
12
13
14
15
16
17
18
19
20
21
22
23
24
25
26
27
28
29
30
31
32
# 1. 完成课堂的所有练习;

# 2. 使⽤filebeat收集以下系统⽇志:
/var/log/secure
/var/log/maillog
/var/log/yum.log
/var/log/firewalld
/var/log/cron
/var/log/messages
# 要求如下:
# 1.在同⼀个filebeat配置⽂件中书写;
# 2.将上述6类⽇志分别写⼊不同的索引,索引前缀名称为"oldboyedu-elk-system-log-{xxx}-%{+yyyy.MM.dd}";
# 3.要求副本数量为0,分⽚数量为10;

# 7.17.3版本可能遇到的问题:
# 1.input源配置⼀旦超过4个,写⼊ES时,就可能会复现出部分数据⽆法写⼊的问题;
# 有两种解决⽅案:
# ⽅案⼀: 拆成多个filebeat实例。运⾏多个filebeat实例时需要指定数据路径"--path.data"。
filebeat -e -c ~/config/23-systemLog-to-es.yml --path.data /tmp/filebeat
# ⽅案⼆: ⽇志聚合思路解决问题。
# 1)部署服务
yum -y install rsyslog
# 2)修改配置⽂件
vim /etc/rsyslog.conf
...
$ModLoad imtcp
$InputTCPServerRun 514
...
*.* /var/log/oldboyedu.log
# 3)重启服务并测试
systemctl restart rsyslog
logger "1111"

⽅案⼀:filebeat 多实例

filebeat 实例⼀:

1
2
3
4
5
6
7
8
9
10
11
12
13
14
15
16
17
18
19
20
21
22
23
24
25
26
27
28
29
30
31
32
33
34
35
36
37
38
filebeat.inputs:
- type: filestream
enabled: true
paths:
- /var/log/firewalld
tags: ["firewalld"]
- type: filestream
enabled: true
paths:
- /var/log/cron
tags: ["cron"]
- type: filestream
enabled: true
paths:
- /var/log/messages
tags: ["message"]

output.elasticsearch:
enabled: true
hosts: ["http://10.0.0.101:9200", "http://10.0.0.102:9200", "http://10.0.0.103:9200"]
indices:
- index: "oldboyedu-elk-system-log-firewalld-%{+yyyy.MM.dd}"
when.contains:
tags: "firewalld"
- index: "oldboyedu-elk-system-log-cron-%{+yyyy.MM.dd}"
when.contains:
tags: "cron"
- index: "oldboyedu-elk-system-log-message-%{+yyyy.MM.dd}"
when.contains:
tags: "message"

setup.ilm.enabled: false
setup.template.name: "oldboyedu-elk-system-log"
setup.template.pattern: "oldboyedu-elk-system-log*"
setup.template.overwrite: true
setup.template.settings:
index.number_of_shards: 10
index.number_of_replicas: 0

filebeat 实例二:

1
2
3
4
5
6
7
8
9
10
11
12
13
14
15
16
17
18
19
20
21
22
23
24
25
26
27
28
29
30
31
32
33
34
35
36
37
38
filebeat.inputs:
- type: filestream
enabled: true
paths:
- /var/log/secure
tags: ["secure"]
- type: filestream
enabled: true
paths:
- /var/log/maillog
tags: ["maillog"]
- type: filestream
enabled: true
paths:
- /var/log/yum.log
tags: ["yum"]

output.elasticsearch:
enabled: true
hosts: ["http://10.0.0.101:9200", "http://10.0.0.102:9200", "http://10.0.0.103:9200"]
indices:
- index: "oldboyedu-elk-system-log-secure-%{+yyyy.MM.dd}"
when.contains:
tags: "secure"
- index: "oldboyedu-elk-system-log-maillog-%{+yyyy.MM.dd}"
when.contains:
tags: "maillog"
- index: "oldboyedu-elk-system-log-yum-%{+yyyy.MM.dd}"
when.contains:
tags: "yum"

setup.ilm.enabled: false
setup.template.name: "oldboyedu-elk-system-log"
setup.template.pattern: "oldboyedu-elk-system-log*"
setup.template.overwrite: true
setup.template.settings:
index.number_of_shards: 10
index.number_of_replicas: 0

方案二:基于 rsyslog 案例

1
2
3
4
5
6
7
8
9
10
11
12
13
14
15
16
17
18
19
20
21
22
filebeat.inputs:
- type: filestream
enabled: true
paths:
- /var/log/oldboyedu.log
tags: ["rsyslog"]

output.elasticsearch:
enabled: true
hosts: ["http://10.0.0.101:9200", "http://10.0.0.102:9200", "http://10.0.0.103:9200"]
indices:
- index: "oldboyedu-elk-system-rsyslog--%{+yyyy.MM.dd}"
when.contains:
tags: "rsyslog"

setup.ilm.enabled: false
setup.template.name: "oldboyedu-elk-system-log"
setup.template.pattern: "oldboyedu-elk-system-log*"
setup.template.overwrite: true
setup.template.settings:
index.number_of_shards: 10
index.number_of_replicas: 0

部署 logstash 环境及基础使用

1.部署 logstash 环境

1
2
3
4
yum -y localinstall logstash-7.17.3-x86_64.rpm
ln -sv /usr/share/logstash/bin/logstash /usr/local/bin/

# 下载地址: https://www.elastic.co/downloads/past-releases#logstash

2.修改 logstash 的配置⽂件

1
2
3
4
5
6
7
8
9
10
11
12
13
14
15
# (1)编写配置⽂件
cat > conf.d/01-stdin-to-stdout.conf <<EOF
input {
stdin {}
}
output {
stdout {}
}
EOF

# (2)检查配置⽂件语法
logstash -tf conf.d/01-stdin-to-stdout.conf

# (3)启动logstash实例
logstash -f conf.d/01-stdin-to-stdout.conf

3.input 插件基于 file 案例

1
2
3
4
5
6
7
8
9
10
11
12
13
input {
file {
# 指定收集的路径
path => ["/tmp/test/*.txt"]
# 指定⽂件的读取位置,仅在".sincedb*"⽂件中没有记录的情况下⽣效!
start_position => "beginning"
# start_position => "end"
}
}

output {
stdout {}
}

4.input 插件基于 tcp 案例

1
2
3
4
5
6
7
8
9
10
11
12
input {
tcp {
port => 8888
}
tcp {
port => 9999
}
}

output {
stdout {}
}

5.input 插件基于 http 案例

1
2
3
4
5
6
7
8
9
10
11
12
input {
http {
port => 8888
}
http {
port => 9999
}
}

output {
stdout {}
}

6.input 插件基于 redis 案例

1
2
3
4
5
6
7
8
9
10
11
12
13
14
15
16
17
18
19
20
21
22
23
24
25
26
27
# filebeat的配置:(仅供参考)
filebeat.inputs:
- type: tcp
host: "0.0.0.0:9000"

output.redis:
hosts: ["10.0.0.101:6379"] # 写⼊redis的主机地址
password: "oldboyedu" # 指定redis的认证⼝令
db: 5 # 指定连接数据库的编号
key: "oldboyedu-linux80-filebeat" # 指定的key值
timeout: 3 # 规定超时时间.

# logstash的配置:
input {
redis {
data_type => "list" # 指定的是REDIS的键(key)的类型
db => 5 # 指定数据库的编号,默认值是0号数据库
host => "10.0.0.101" # 指定数据库的ip地址,默认值是localhost
port => 6379 # 指定数据库的端⼝号,默认值为6379
password => "oldboyedu" # 指定redis的认证密码
key => "oldboyedu-linux80-filebeat" # 指定从redis的哪个key取数据
}
}

output {
stdout {}
}

7.input 插件基于 beats 案例

1
2
3
4
5
6
7
8
9
10
11
12
13
14
15
16
# filbeat配置:
filebeat.inputs:
- type: tcp
host: "0.0.0.0:9000"
output.logstash:
hosts: ["10.0.0.101:5044"]

# logstsh配置:
input {
beats {
port => 5044
}
}
output {
stdout {}
}

8.output 插件基于 redis 案例

1
2
3
4
5
6
7
8
9
10
11
12
13
14
15
16
input {
tcp {
port => 9999
}
}
output {
stdout {}
redis {
host => "10.0.0.101" # 指定redis的主机地址
port => "6379" # 指定redis的端⼝号
db => 10 # 指定redis数据库编号
password => "oldboyedu" # 指定redis的密码
data_type => "list" # 指定写⼊数据的key类型
key => "oldboyedu-linux80-logstash" # 指定的写⼊的key名称
}
}

9.output 插件基于 file 案例

1
2
3
4
5
6
7
8
9
10
11
12
input {
tcp {
port => 9999
}
}
output {
stdout {}
file {
# 指定磁盘的落地位置
path => "/tmp/oldboyedu-linux80-logstash.log"
}
}

10.logstash 综合案例

1.filebeat-to-redis 参考笔记

1
2
3
4
5
6
7
8
9
filebeat.inputs:
- type: tcp
host: "0.0.0.0:8888"

output.redis:
hosts: ["10.0.0.101:6379"] # 写⼊redis的主机地址
password: "oldboyedu" # 指定redis的认证⼝令
key: "oldboyedu-linux80-filebeat" # 指定的key值
timeout: 3 # 规定超时时间.

2.filebeat-to-logstash 参考笔记

1
2
3
4
5
filebeat.inputs:
- type: tcp
host: "0.0.0.0:9999"
output.logstash:
hosts: ["10.0.0.101:7777"]

3.logstash 配置⽂件

1
2
3
4
5
6
7
8
9
10
11
12
13
14
15
16
17
18
19
20
21
22
23
24
25
26
27
28
29
30
31
32
33
34
35
36
37
38
39
40
41
42
43
44
input {
tcp {
type => "oldboyedu-tcp"
port => 6666
}
beats {
type => "oldboyedu-beat"
port => 7777
}
redis {
type => "oldboyedu-redis"
data_type => "list"
db => 5
host => "10.0.0.101"
port => 6379
password => "oldboyedu"
key => "oldboyedu-linux80-filebeat"
}
}

output {
stdout {}
if [type] == "oldboyedu-tcp" {
elasticsearch {
hosts => ["10.0.0.101:9200","10.0.0.102:9200","10.0.0.103:9200"]
index => "oldboyedu-linux80-tcp-%{+YYYY.MM.dd}"
}
} else if [type] == "oldboyedu-beat" {
elasticsearch {
hosts => ["10.0.0.101:9200","10.0.0.102:9200","10.0.0.103:9200"]
index => "oldboyedu-linux80-beat-%{+YYYY.MM.dd}"
}
} else if [type] == "oldboyedu-redis" {
elasticsearch {
hosts => ["10.0.0.101:9200","10.0.0.102:9200","10.0.0.103:9200"]
index => "oldboyedu-linux80-redis-%{+YYYY.MM.dd}"
}
} else {
elasticsearch {
hosts => ["10.0.0.101:9200","10.0.0.102:9200","10.0.0.103:9200"]
index => "oldboyedu-linux80-other-%{+YYYY.MM.dd}"
}
}
}

11.今日作业

1
2
(1)完成课堂的所有练习,要求能够⼿绘架构图;
(2)如上图所示,按照上述要求完成作业;

11.1 运行一个 logsash 版本

1
2
3
4
5
6
7
8
9
10
11
12
13
14
15
16
17
18
19
20
21
22
23
24
[root@elk101.oldboyedu.com ~]$ cat config-logstash/11-many-to-es.conf
input {
beats {
port => 8888
}
redis {
data_type => "list"
db => 8
host => "10.0.0.101"
port => 6379
password => "oldboyedu"
key => "oldboyedu-linux80-filebeat"
}
}
output {
stdout {}
elasticsearch {
hosts => ["10.0.0.101:9200","10.0.0.102:9200","10.0.0.103:9200"]
index => "oldboyedu-linux80-logstash-%{+YYYY.MM.dd}"
}
}

[root@elk101.oldboyedu.com ~]$
[root@elk101.oldboyedu.com ~]$ logstash -f config-logstash/11-many-to-es.conf

11.2.运行两个 logstash 版本

1
2
3
4
5
6
7
8
9
10
11
12
13
14
15
16
17
18
19
20
21
22
23
24
25
26
27
28
29
30
31
32
33
34
35
36
37
38
39
40
# logstash接受redis示例:
[root@elk101.oldboyedu.com ~]$ cat config-logstash/13-redis-to-es.conf
input {
redis {
data_type => "list"
db => 8
host => "10.0.0.101"
port => 6379
password => "oldboyedu"
key => "oldboyedu-linux80-filebeat"
}
}
output {
stdout {}
elasticsearch {
hosts => ["10.0.0.101:9200","10.0.0.102:9200","10.0.0.103:9200"]
index => "oldboyedu-linux80-logstash-%{+YYYY.MM.dd}"
}
}

[root@elk101.oldboyedu.com ~]$
[root@elk101.oldboyedu.com ~]$ logstash -f config-logstash/13-redis-to-es.conf

#logstash接受beats示例:
[root@elk101.oldboyedu.com ~]$ cat config-logstash/12-beat-to-es.conf
input {
beats {
port => 8888
}
}
output {
stdout {}
elasticsearch {
hosts => ["10.0.0.101:9200","10.0.0.102:9200","10.0.0.103:9200"]
index => "oldboyedu-linux80-logstash-%{+YYYY.MM.dd}"
}
}

[root@elk101.oldboyedu.com ~]$
[root@elk101.oldboyedu.com ~]$ logstash -f config-logstash/12-beat-to-es.conf --path.data /tmp/logstash

logstash 企业级插件案例(ELFK 架构)

1.gork 插件概述

Grok 是将⾮结构化⽇志数据解析为结构化和可查询的好⽅法。底层原理是基于正则匹配任意⽂本格式。
该⼯具⾮常适合 syslog ⽇志、apache 和其他⽹络服务器⽇志、mysql ⽇志,以及通常为⼈类⽽⾮计算机消耗⽽编写的任何⽇志格式。
内置 120 种匹配模式,当然也可以⾃定义匹配模式:
https://github.com/logstash-plugins/logstash-patterns-core/tree/master/patterns

2.使⽤ grok 内置的正则案例 1

1
2
3
4
5
6
7
8
9
10
11
12
13
14
15
16
17
18
19
20
21
22
23
24
25
26
[root@elk101.oldboyedu.com ~]$ cat config-logstash/14-beat-grok-es.conf
input {
beats {
port => 8888
}
}
filter {
grok {
match => {
# "message" => "%{COMBINEDAPACHELOG}"
# 上⾯的""变量官⽅github上已经废弃,建议使⽤下⾯的匹配模式
# https://github.com/logstash-plugins/logstash-patterns-core/blob/main/patterns/legacy/httpd
"message" => "%{HTTPD_COMMONLOG}"
}
}
}

output {
stdout {}
elasticsearch {
hosts => ["10.0.0.101:9200","10.0.0.102:9200","10.0.0.103:9200"]
index => "oldboyedu-linux80-logstash-%{+YYYY.MM.dd}"
}
}
[root@elk101.oldboyedu.com ~]$
[root@elk101.oldboyedu.com ~]$ logstash -rf config-logstash/14-beat-grok-es.conf

3.使用 grok 内置的正则案例 2

1
2
3
4
5
6
7
8
9
10
11
12
13
14
15
16
17
18
19
20
21
22
23
[root@elk101.oldboyedu.com ~]$ cat config-logstash/15-stdin-grok-stdout.conf
input {
stdin {}
}
filter {
grok {
match => {
"message" => "%{IP:oldboyedu-client} %{WORD:oldboyedu-method} %{URIPATHPARAM:oldboyedu-request} %{NUMBER:oldboyedu-bytes} %{NUMBER:oldboyedu-duration}"
}
}
}
output {
stdout {}
}
[root@elk101.oldboyedu.com ~]$
[root@elk101.oldboyedu.com ~]$ logstash -f config-logstash/15-stdin-grok-stdout.conf


# 温馨提示:(如下图所示,按照要求输⼊数据)
55.3.244.1 GET /index.html 15824 0.043
10.0.0.103 POST /oldboyedu.html 888888 5.20
# 参考地址:
https://github.com/logstash-plugins/logstash-patterns-core/tree/main/patterns/legacy

4.使用 grop 自定义的正则案例

1
2
3
4
5
6
7
8
9
10
11
12
13
14
15
16
17
18
19
20
21
22
23
24
[root@elk101.oldboyedu.com ~]$ cat config-logstash/16-stdin-grok_custom_patterns-stdout.conf
input {
stdin {}
}
filter {
grok {
# 指定匹配模式的⽬录,可以使⽤绝对路径哟~
# 在./patterns⽬录下随便创建⼀个⽂件,并写⼊以下匹配模式
# POSTFIX_QUEUEID [0-9A-F]{10,11}
# OLDBOYEDU_LINUX80 [\d]{3}
patterns_dir => ["./patterns"]
# 匹配模式
# 测试数据为: Jan 1 06:25:43 mailserver14 postfix/cleanup[21403]:BEF25A72965: message-id=<20130101142543.5828399CCAF@mailserver14.example.com>
# match => { "message" => "%{SYSLOGBASE} %{POSTFIX_QUEUEID:queue_id}: %{GREEDYDATA:syslog_message}" }
# 测试数据为: ABCDE12345678910 ---> 333FGHIJK
match => { "message" => "%{POSTFIX_QUEUEID:oldboyedu_queue_id} ---> %{OLDBOYEDU_LINUX80:oldboyedu_linux80_elk}" }
}
}
output {
stdout {}
}

[root@elk101.oldboyedu.com ~]$
[root@elk101.oldboyedu.com ~]$ logstash -f config-logstash/16-stdin-grok_custom_patterns-stdout.conf

5.filter 插件通用字段案例

1
2
3
4
5
6
7
8
9
10
11
12
13
14
15
16
17
18
19
20
21
22
23
24
25
26
27
28
29
30
31
32
33
34
35
36
37
38
39
[root@elk101.oldboyedu.com ~]$ cat config-logstash/17-beat-grok-es.conf
input {
beats {
port => 8888
}
}
filter {
grok {
match => {
# "message" => "%{COMBINEDAPACHELOG}"
# 上⾯的""变量官⽅github上已经废弃,建议使⽤下⾯的匹配模式
# https://github.com/logstash-plugins/logstash-patterns-core/blob/main/patterns/legacy/httpd
"message" => "%{HTTPD_COMMONLOG}"
}
# 移除指定的字段
remove_field => [ "host", "@version", "ecs","tags","agent","input", "log" ]
# 添加指定的字段
add_field => {
"school" => "北京市昌平区沙河镇⽼男孩IT教育"
"oldboyedu-clientip" => "clientip ---> %{clientip}"
}
# 添加tag
add_tag => [ "linux80","zookeeper","kafka","elk" ]
# 移除tag
remove_tag => [ "zookeeper", "kafka" ]
# 创建插件的唯⼀ID,如果不创建则系统默认⽣成
id => "nginx"
}
}
output {
stdout {}
# elasticsearch {
# hosts => ["10.0.0.101:9200","10.0.0.102:9200","10.0.0.103:9200"]
# index => "oldboyedu-linux80-logstash-%{+YYYY.MM.dd}"
# }
}
[root@elk101.oldboyedu.com ~]$
[root@elk101.oldboyedu.com ~]$
[root@elk101.oldboyedu.com ~]$ logstash -rf config-logstash/17-beat-grok-es.conf

6.date 插件修改写入 ES 的时间

1
2
3
4
5
6
7
8
9
10
11
12
13
14
15
16
17
18
19
20
21
22
23
24
25
26
27
28
29
30
31
32
33
34
35
36
37
38
39
40
41
42
43
[root@elk101.oldboyedu.com ~]$ cat config-logstash/18-beat-grok_date-es.conf
input {
beats {
port => 8888
}
}
filter {
grok {
match => {
# "message" => "%{COMBINEDAPACHELOG}"
# 上⾯的""变量官⽅github上已经废弃,建议使⽤下⾯的匹配模式
# https://github.com/logstash-plugins/logstash-patterns-core/blob/main/patterns/legacy/httpd
"message" => "%{HTTPD_COMMONLOG}"
}
# 移除指定的字段
remove_field => [ "host", "@version", "ecs","tags","agent","input", "log" ]
# 添加指定的字段
add_field => {
"school" => "北京市昌平区沙河镇⽼男孩IT教育"
}
}
date {
# 匹配时间字段并解析,值得注意的是,logstash的输出时间可能会错8⼩时,但写⼊es但数据是准确的!
# "13/May/2022:15:47:24 +0800", 以下2种match写法均可!
# match => ["timestamp","dd/MMM/yyyy:HH:mm:ss Z"]
# 当然,我们也可以不对时区字段进⾏解析,⽽是使⽤"timezone"指定时区哟!
match => ["timestamp","dd/MMM/yyyy:HH:mm:ss +0800"]
# 设置时区字段为UTC时间,写⼊ES的数据时间是不准确的
# timezone => "UTC"
# 建议⼤家设置为"Asia/Shanghai",写⼊ES的数据是准确的!
timezone => "Asia/Shanghai"
# 将匹配到到时间字段解析后存储到⽬标字段,若不指定,则默认字段为"@timestamp"字段
target => "oldboyedu-linux80-nginx-access-time"
}
}
output {
stdout {}
elasticsearch {
hosts => ["10.0.0.101:9200","10.0.0.102:9200","10.0.0.103:9200"]
index => "oldboyedu-linux80-logstash-%{+YYYY.MM.dd}"
}
}
[root@elk101.oldboyedu.com ~]$ logstash -rf config-logstash/18-beat-grok_date-es.conf

7.geoip 分析源地址的地址位置

1
2
3
4
5
6
7
8
9
10
11
12
13
14
15
16
17
18
19
20
21
22
23
24
25
26
27
28
29
30
31
32
33
34
35
36
37
38
39
[root@elk101.oldboyedu.com ~]$ cat config-logstash/19-beat-grok_date_geoip-es.conf
input {
beats {
port => 8888
}
}
filter {
grok {
match => {
"message" => "%{HTTPD_COMMONLOG}"
}
remove_field => [ "host", "@version", "ecs","tags","agent","input", "log" ]
add_field => {
"school" => "北京市昌平区沙河镇⽼男孩IT教育"
}
}
date {
match => ["timestamp","dd/MMM/yyyy:HH:mm:ss Z"]
timezone => "Asia/Shanghai"
target => "oldboyedu-linux80-nginx-access-time"
}
geoip {
# 指定基于哪个字段分析IP地址
source => "clientip"
# 如果期望查看指定的字段,则可以在这⾥配置即可,若不设置,表示显示所有的查询字段.
fields => ["city_name","country_name","ip"]
# 指定geoip的输出字段,如果想要对多个IP地址进⾏分析,则该字段很有⽤哟~
target => "oldboyedu-linux80"
}
}
output {
stdout {}
elasticsearch {
hosts => ["10.0.0.101:9200","10.0.0.102:9200","10.0.0.103:9200"]
index => "oldboyedu-linux80-logstash-%{+YYYY.MM.dd}"
}
}
[root@elk101.oldboyedu.com ~]$
[root@elk101.oldboyedu.com ~]$ logstash -rf config-logstash/19-beat-grok_date_geoip-es.conf

8.useragent 分析客户端的设备类型

1
2
3
4
5
6
7
8
9
10
11
12
13
14
15
16
17
18
19
20
21
22
23
24
25
26
27
28
29
30
31
32
33
34
35
36
37
38
39
[root@elk101.oldboyedu.com ~]# cat config-logstash/20-beat-grok_date_geoip_useragent-es.conf
input {
beats {
port => 8888
}
}
filter {
date {
match => ["timestamp","dd/MMM/yyyy:HH:mm:ss Z"]
timezone => "Asia/Shanghai"
target => "oldboyedu-linux80-nginx-access-time"
}
mutate {
add_field => {
"school" => "北京市昌平区沙河镇⽼男孩IT教育"
}
remove_field => [ "agent", "host", "@version", "ecs","tags","input", "log" ]
}
geoip {
source => "clientip"
fields => ["city_name","country_name","ip"]
target => "oldboyedu-linux80-geoip"
}
useragent {
# 指定客户端的设备相关信息的字段
source => "http_user_agent"
# 将分析的数据存储在⼀个指定的字段中,若不指定,则默认存储在target字段中。
target => "oldboyedu-linux80-useragent"
}
}
output {
stdout {}
elasticsearch {
hosts => ["10.0.0.101:9200","10.0.0.102:9200","10.0.0.103:9200"]
index => "oldboyedu-linux80-logstash-%{+YYYY.MM.dd}"
}
}
[root@elk101.oldboyedu.com ~]$
[root@elk101.oldboyedu.com ~]$ logstash -rf config-logstash/20-beat-grok_date_geoip_useragent-es.conf

9.mutate 组件数据准备-python 脚本

1
2
3
4
5
6
7
8
9
10
11
12
13
14
15
16
17
18
19
20
21
22
23
24
25
26
27
28
29
cat > generate_log.py <<EOF
#!/usr/bin/env python
# -*- coding: UTF-8 -*-
# @author : oldboyedu-linux80

import datetime
import random
import logging
import time
import sys

LOG_FORMAT = "%(levelname)s %(asctime)s [com.oldboyedu.%(module)s] - %(message)s "
DATE_FORMAT = "%Y-%m-%d %H:%M:%S"

# 配置root的logging.Logger实例的基本配置
logging.basicConfig(level=logging.INFO, format=LOG_FORMAT,datefmt=DATE_FORMAT, filename=sys.argv[1], filemode='a',)
actions = ["浏览⻚⾯", "评论商品", "加⼊收藏", "加⼊购物⻋", "提交订单", "使⽤优惠券", "领取优惠券","搜索", "查看订单", "付款", "清空购物⻋"]

while True:
time.sleep(random.randint(1, 5))
user_id = random.randint(1, 10000)
# 对⽣成的浮点数保留2位有效数字.
price = round(random.uniform(15000, 30000),2)
action = random.choice(actions)
svip = random.choice([0,1])
logging.info("DAU|{0}|{1}|{2}|{3}".format(user_id,action,svip,price))
EOF

$ nohup python generate_log.py /tmp/app.log &>/dev/null &

9.mutate 组件常⽤字段案例

1
2
3
4
5
6
7
8
9
10
11
12
13
14
15
16
17
18
19
20
21
22
23
24
25
26
27
28
29
30
31
32
33
34
35
36
37
38
39
40
41
42
43
44
45
46
47
48
49
50
51
52
53
54
55
56
57
58
59
60
61
62
63
64
65
66
67
[root@elk101.oldboyedu.com ~]# cat config-logstash/21-mutate.conf
input {
beats {
port => 8888
}
}
filter {
mutate {
add_field => {
"school" => "北京市昌平区沙河镇⽼男孩IT教育"
}
remove_field => [ "@timestamp", "agent", "host", "@version", "ecs","tags","input", "log" ]
}
mutate {
# 对"message"字段内容使⽤"|"进⾏切分。
split => {
"message" => "|"
}
}
mutate {
# 添加字段,其中引⽤到了变量
add_field => {
"user_id" => "%{[message][1]}"
"action" => "%{[message][2]}"
"svip" => "%{[message][3]}"
"price" => "%{[message][4]}"
}
}
mutate {
strip => ["svip"]
}
mutate {
# 将指定字段转换成相应对数据类型.
convert => {
"user_id" => "integer"
"svip" => "boolean"
"price" => "float"
}
}
mutate {
# 将"price"字段拷⻉到"oldboyedu-linux80-price"字段中.
copy => { "price" => "oldboyedu-linux80-price" }
}
mutate {
# 修改字段到名称
rename => { "svip" => "oldboyedu-ssvip" }
}
mutate {
# 替换字段的内容
replace => { "message" => "%{message}: My new message" }
}
mutate {
# 将指定字段的字⺟全部⼤写
uppercase => [ "message" ]
}
}

output {
stdout {}
elasticsearch {
hosts => ["10.0.0.101:9200","10.0.0.102:9200","10.0.0.103:9200"]
index => "oldboyedu-linux80-logstash-%{+YYYY.MM.dd}"
}
}

[root@elk101.oldboyedu.com ~]$
[root@elk101.oldboyedu.com ~]$ logstash -rf config-logstash/21-mutate.conf

10.logstash 的多 if 分支案例

1
2
3
4
5
6
7
8
9
10
11
12
13
14
15
16
17
18
19
20
21
22
23
24
25
26
27
28
29
30
31
32
33
34
35
36
37
38
39
40
41
42
43
44
45
46
47
48
49
50
51
52
53
54
55
56
57
58
59
60
61
62
63
64
65
66
67
68
69
70
71
72
73
74
75
76
77
78
79
80
81
82
83
84
85
86
87
88
89
90
91
92
93
94
95
96
[root@elk101.oldboyedu.com ~]# cat config-logstash/22-beats_tcp-filter-es.conf
input {
beats {
type => "oldboyedu-beats"
port => 8888
}
tcp {
type => "oldboyedu-tcp"
port => 9999
}
tcp {
type => "oldboyedu-tcp-new"
port => 7777
}
http {
type => "oldboyedu-http"
port => 6666
}
file {
type => "oldboyedu-file"
path => "/tmp/apps.log"
}
}

filter {
mutate {
add_field => {
"school" => "北京市昌平区沙河镇⽼男孩IT教育"
}
}
if [type] == ["oldboyedu-beats","oldboyedu-tcp-new","oldboyedu-http"]{
mutate {
remove_field => [ "agent", "host", "@version", "ecs","tags","input", "log" ]
}
geoip {
source => "clientip"
target => "oldboyedu-linux80-geoip"
}
useragent {
source => "http_user_agent"
target => "oldboyedu-linux80-useragent"
}
} else if [type] == "oldboyedu-file" {
mutate {
add_field => {
"class" => "oldboyedu-linux80"
"address" => "北京昌平区沙河镇⽼男孩IT教育"
"hobby" => ["LOL","王者荣耀"]
}
remove_field => ["host","@version","school"]
}
} else {
mutate {
remove_field => ["port","@version","host"]
}
mutate {
split => {
"message" => "|"
}
add_field => {
"user_id" => "%{[message][1]}"
"action" => "%{[message][2]}"
"svip" => "%{[message][3]}"
"price" => "%{[message][4]}"
}
# 利⽤完message字段后,在删除是可以等!注意代码等执⾏顺序!
remove_field => ["message"]
strip => ["svip"]
}
mutate {
convert => {
"user_id" => "integer"
"svip" => "boolean"
"price" => "float"
}
}
}
}

output {
stdout {}
if [type] == "oldboyedu-beats" {
elasticsearch {
hosts => ["10.0.0.101:9200","10.0.0.102:9200","10.0.0.103:9200"]
index => "oldboyedu-linux80-logstash-beats"
}
} else {
elasticsearch {
hosts => ["10.0.0.101:9200","10.0.0.102:9200","10.0.0.103:9200"]
index => "oldboyedu-linux80-logstash-tcp"
}
}
}

[root@elk101.oldboyedu.com ~]$
[root@elk101.oldboyedu.com ~]$ logstash -rf config-logstash/22-beats_tcp-filter-es.conf

11.今日作业

1
2
3
4
5
6
7
如上图所示,要求完成以下内容:
(1)收集nginx⽇志,写⼊ES集群,分⽚数量为3,副本数量为0,索引名称为"oldboyedu-linux80-nginx";
(2)收集tomcat⽇志,写⼊ES集群,分⽚数量为5,副本数量为0,索引名称为"oldboyedu-linux80-tomcat";
(3)收集app⽇志,写⼊ES集群,分⽚数量为10,副本数量为0,索引名称为"oldboyedu-linux80-app";
进阶作业:
(1)分析出nginx,tomcat的客户端ip所属城市,访问时使⽤的设备类型等。
(2)请调研使⽤logstash的pipline来替代logstash的多实例⽅案;

filebeat 手机 tomcat 日志

1
2
3
4
5
6
7
8
9
10
11
12
13
[root@elk102.oldboyedu.com ~]# cat ~/config/38-tomcat-to-logstash.yml
filebeat.inputs:
- type: log
enabled: true
paths:
- /oldboyedu/softwares/apache-tomcat-10.0.20/logs/*.txt
json.keys_under_root: true

output.logstash:
hosts: ["10.0.0.101:7777"]

[root@elk102.oldboyedu.com ~]$
[root@elk102.oldboyedu.com ~]$ filebeat -e -c ~/config/38-tomcat-to-logstash.yml

filebeat 收集 nginx 日志

1
2
3
4
5
6
7
8
9
10
11
12
13
[root@elk102.oldboyedu.com ~]# cat ~/config/37-nginx-to-logstash.yml
filebeat.inputs:
- type: log
enabled: true
paths:
- /var/log/nginx/access.log*
json.keys_under_root: true

output.logstash:
hosts: ["10.0.0.101:8888"]

[root@elk102.oldboyedu.com ~]$
[root@elk102.oldboyedu.com ~]$ filebeat -e -c ~/config/37-nginx-to-logstash.yml --path.data /tmp/filebeat-nginx

filebeat 收集 apps 日志

1
2
3
4
5
6
7
8
9
10
11
[root@elk102.oldboyedu.com ~]# cat ~/config/39-apps-to-logstash.yml
filebeat.inputs:
- type: log
enabled: true
paths:
- /tmp/app.log*
output.logstash:
hosts: ["10.0.0.101:6666"]

[root@elk102.oldboyedu.com ~]$
[root@elk102.oldboyedu.com ~]$ filebeat -e -c ~/config/39-apps-to-logstash.yml --path.data /tmp/filebeat-app

logstash 收集 nginx 日志

1
2
3
4
5
6
7
8
9
10
11
12
13
14
15
16
17
18
19
20
21
22
23
24
25
26
27
28
[root@elk101.oldboyedu.com ~]# cat config-logstash/24-homework-01-to-es.conf
input {
beats {
port => 8888
}
}
filter {
mutate {
remove_field => ["tags","log","agent","@version", "input","ecs"]
}
geoip {
source => "clientip"
target => "oldboyedu-linux80-geoip"
}
useragent {
source => "http_user_agent"
target => "oldboyedu-linux80-useragent"
}
}
output {
stdout {}
elasticsearch {
hosts => ["10.0.0.101:9200","10.0.0.102:9200","10.0.0.103:9200"]
index => "oldboyedu-linux80-nginx"
}
}

[root@elk101.oldboyedu.com ~]# logstash -rf config-logstash/24-homework-01-to-es.conf

logstash 收集 tomcat 日志

1
2
3
4
5
6
7
8
9
10
11
12
13
14
15
16
17
18
19
20
21
22
23
24
25
26
27
28
29
30
[root@elk101.oldboyedu.com ~]# cat config-logstash/24-homework-02-to-es.conf
input {
beats {
port => 7777
}
}
filter {
mutate {
remove_field => ["tags","log","agent","@version", "input","ecs"]
}
geoip {
source => "clientip"
target => "oldboyedu-linux80-geoip"
}
useragent {
source => "AgentVersion"
target => "oldboyedu-linux80-useragent"
}
}

output {
stdout {}
elasticsearch {
hosts => ["10.0.0.101:9200","10.0.0.102:9200","10.0.0.103:9200"]
index => "oldboyedu-linux80-tomcat"
}
}

[root@elk101.oldboyedu.com ~]$
[root@elk101.oldboyedu.com ~]$ logstash -rf config-logstash/24-homework-02-to-es.conf --path.data /tmp/homework-logstash-02

logstash 收集 apps 日志

1
2
3
4
5
6
7
8
9
10
11
12
13
14
15
16
17
18
19
20
21
22
23
24
25
26
27
28
29
30
31
32
33
34
35
36
37
38
39
40
41
42
43
44
45
[root@elk101.oldboyedu.com ~]# cat config-logstash/24-homework-03-to-es.conf
input {
beats {
port => 6666
}
}
filter {
mutate {
remove_field => ["tags","log","agent","@version", "input","ecs"]
}
mutate {
remove_field => ["port","@version","host"]
}
mutate {
split => {
"message" => "|"
}
add_field => {
"user_id" => "%{[message][1]}"
"action" => "%{[message][2]}"
"svip" => "%{[message][3]}"
"price" => "%{[message][4]}"
}
remove_field => ["message"]
strip => ["svip"]
}
mutate {
convert => {
"user_id" => "integer"
"svip" => "boolean"
"price" => "float"
}
}
}

output {
stdout {}
elasticsearch {
hosts => ["10.0.0.101:9200","10.0.0.102:9200","10.0.0.103:9200"]
index => "oldboyedu-linux80-apps"
}
}

[root@elk101.oldboyedu.com ~]$
[root@elk101.oldboyedu.com ~]$ logstash -rf config-logstash/24-homework-03-to-es.conf --path.data /tmp/homework-logstash-03

kibana 自定义 dashboard 实战案例

1.统计 pv(指标)

1
2
3
4
5
6
7
8
9
10
11
12
13
Page View(简称:"PV")
⻚⾯访问或点击量。

kibana界⾯⿏标依次点击如下:
(1)菜单栏;
(2)Visualize Library(可视化库);
(3)新建可视化
(4)基于聚合
(5)指标
(6)选择索引模式(例如"oldboyedu-linux80-nginx*")
(7)指标栏中选择:
聚合: 计数
定制标签: PV

2.统计客户端 IP(指标)

1
2
3
4
5
6
7
8
9
10
11
12
13
14
客户端IP:
通常指的是访问Web服务器的客户端IP地址,但要注意,客户端IP数量并不难代表UV。

kibana界⾯⿏标依次点击如下:
(1)菜单栏;
(2)Visualize Library(可视化库);
(3)创建可视化
(4)基于聚合
(5)指标
(6)选择索引模式(例如"oldboyedu-linux80-nginx*")
(7)指标栏中选择:
聚合: 唯⼀计数
字段: clientip.keyword
定制标签: IP

3.统计 web 下载带宽(指标)

1
2
3
4
5
6
7
8
9
10
11
12
13
14
带宽:
统计nginx返回给客户端⽂件⼤⼩的字段进⾏累计求和。

kibana界⾯⿏标依次点击如下:
(1)菜单栏;
(2)Visualize Library(可视化库);
(3)创建可视化
(4)基于聚合
(5)指标
(6)选择索引模式(例如"oldboyedu-linux80-nginx*")
(7)指标栏中选择:
聚合: 求和
字段: SendBytes
定制标签: 带宽

4.访问页面统计(水平条形图)

1
2
3
4
5
6
7
8
9
10
11
12
13
14
15
16
17
18
访问资源统计:
对URI的访问次数统计。

kibana界⾯⿏标依次点击如下:
(1)菜单栏;
(2)Visualize Library(可视化库);
(3)创建可视化
(4)基于聚合
(5)⽔平条形图
(6)选择索引模式(例如"oldboyedu-linux80-nginx*")
(7)指标栏中设置(即Y轴)
聚合: 计数
定制标签: 访问量
(8)添加"存储痛",选择"X"轴
聚合: 词
字段: uri.keyword
...
定制标签: URI

5.分析客户端的城市分布(垂直条形图)

1
2
3
4
5
6
7
8
9
10
11
12
13
14
15
16
17
18
分析客户端的城市分布:
需要借助logstash的filter插件的geoip实现对客户端的IP地址进⾏地域解析。

kibana界⾯⿏标依次点击如下:
(1)菜单栏;
(2)Visualize Library(可视化库);
(3)创建可视化
(4)基于聚合
(5)垂直条形图
(6)选择索引模式(例如"oldboyedu-linux80-nginx*")
(7)指标栏中设置(即Y轴)
聚合: 计数
定制标签: 城市分布
(8)添加"存储痛",选择"X"轴
聚合: 词
字段: oldboyedu-linux80-nginx.city_name.keyword
...
定制标签: 城市名称

6.城市分布百分比(饼图)

1
2
3
4
5
6
7
8
9
10
11
12
13
14
15
16
17
分析客户端的城市分布:
需要借助logstash的filter插件的geoip实现对客户端的IP地址进⾏地域解析。
kibana界⾯⿏标依次点击如下:
(1)菜单栏;
(2)Visualize Library(可视化库);
(3)创建可视化
(4)基于聚合
(5)饼图
(6)选择索引模式(例如"oldboyedu-linux80-nginx*")
(7)指标栏中设置(即Y轴)
聚合: 计数
定制标签: 城市分布
(8)添加"存储痛",选择"X"轴
聚合: 词
字段: oldboyedu-linux80-nginx.city_name.keyword
...
定制标签: 城市名称

7.IP 的 TopN 统计(仪表盘)

1
2
3
4
5
6
7
8
9
10
11
12
13
14
15
16
17
18
IP的TopN统计:
统计访问量的客户端IP最⼤的是谁。

kibana界⾯⿏标依次点击如下:
(1)菜单栏;
(2)Visualize Library(可视化库);
(3)创建可视化
(4)基于聚合
(5)仪表盘
(6)选择索引模式(例如"oldboyedu-linux80-nginx*")
(7)指标栏中设置(即Y轴)
聚合: 计数
(8)添加"存储痛",选择"X"轴
聚合: 词
字段: client.keyword
顺序: 降序
⼤⼩: 3
...

8.自定义 dashboard

1
2
3
4
5
6
7
kibana界⾯⿏标依次点击如下:
(1)菜单栏;
(2)Dashboard
(3)创建仪表盘
(4)从可视化库中添加即可。

如上图和下图所示,为我添加到dashboard界⾯。

ElasticStack 二进制部署及排错

1.部署 Oracle JDK 环境

1
2
3
4
5
6
7
8
9
10
11
12
13
14
15
16
17
18
19
20
21
22
23
24
25
# 官⽅连接:  https://www.oracle.com/java/technologies/downloads/#java8
# elk101单节点部署oracle jdk步骤:
# (1)创建⼯作⽬录
$ mkdir -pv /oldboyedu/softwares
# (2)解压JDK到指定的⽬录
$ tar xf jdk-8u291-linux-x64.tar.gz -C /oldboyedu/softwares/
# (3)创建符号链接
$ cd /oldboyedu/softwares/ && ln -sv jdk1.8.0_291 jdk
# (4)创建环境变量
$ cat > /etc/profile.d/elk.sh <<EOF
#!/bin/bash
export JAVA_HOME=/oldboyedu/softwares/jdk
export PATH=$PATH:$JAVA_HOME/bin
EOF

$ source /etc/profile.d/elk.sh
# (5)查看JDK的版本号
$ java -version
# 集群部署还需要做下⾯2个步骤:
# (1)同步jdk环境到其他节点
$ data_rsync.sh /oldboyedu/
$ data_rsync.sh /etc/profile.d/elk.sh
# (2)其他节点测试
$ source /etc/profile.d/elk.sh
$ java -version

2.单节点 ES 部署

1
2
3
4
5
6
7
8
9
10
11
12
13
14
15
16
17
18
19
20
21
22
23
24
25
26
27
28
29
30
31
32
33
34
35
36
37
38
39
40
41
42
43
44
45
46
47
48
49
50
51
# (1)下载ES软件
# 略,参考之前的视频。

# (2)解压ES
$ tar xf elasticsearch-7.17.3-linux-x86_64.tar.gz -C /oldboyedu/softwares/

# (3)创建符号链接
$ cd /oldboyedu/softwares/ && ln -sv elasticsearch-7.17.3 es

# (4)配置环境变量
$ cat >> /etc/profile.d/elk.sh <<EOF
export ES_HOME=/oldboyedu/softwares/es
export PATH=$PATH:$ES_HOME/bin
EOF

$ source /etc/profile.d/elk.sh

# (5)创建ES⽤户,⽤于运⾏ES服务
$ useradd oldboyedu

# (6)修改配置⽂件
$ vim /oldboyedu/softwares/es/config/elasticsearch.yml
...
cluster.name: oldboyedu-linux80-elk
network.host: 0.0.0.0
discovery.seed_hosts: ["10.0.0.101"]
cluster.initial_master_nodes: ["10.0.0.101"]

# (7)修改权限
$ chown oldboyedu:oldboyedu -R /oldboyedu/softwares/elasticsearch-7.17.3/

# (8)修改⽂件打开数量的限制(退出当前会话⽴即⽣效)
$ cat > /etc/security/limits.d/elk.conf <<EOF
* soft nofile 65535
* hard nofile 131070
EOF

# (9)修改内核参数的内存映射信息
$ cat > /etc/sysctl.d/elk.conf <<EOF
vm.max_map_count = 262144
EOF
$ sysctl -f /etc/sysctl.d/elk.conf
$ sysctl -q vm.max_map_count

# (10)启动服务("-d"选项代表是后台启动服务.)
$ su -c "elasticsearch" oldboyedu
$ su -c "elasticsearch -d" oldboyedu

# (11)验证服务
$ curl 10.0.0.101:9200
$ curl 10.0.0.101:9200/_cat/nodes

3.修改 ES 的堆(heap)内存大小

1
2
3
4
5
6
7
8
9
10
11
12
13
14
15
16
17
18
19
20
21
22
23
24
25
26
27
28
29
30
31
32
33
前置知识:
jps快速⼊⻔:
作⽤:
查看java相关的进程信息。
常⽤参数:
-l: 显示包名称。
-v: 显示进程的相信信息
-V: 默认就是该选项,表示查看简要信息。
-q: 只查看pid。

jmap快速⼊⻔:
作⽤:
查看java的堆栈信息。
常⽤参数:
-heap: 查看堆内存的⼤⼩。
-dump: 下载堆内存的相关信息。

(1)修改堆内存⼤⼩
vim /oldboyedu/softwares/es/config/jvm.options
...
# 堆内存设置不建议超过32G.
-Xms256m
-Xmx256m

(2)重启服务
kill `jps | grep Elasticsearch | awk '{print $1}'`
su -c "elasticsearch -d" oldboyedu

(3)验证堆内存的⼤⼩
jmap -heap `jps | grep Elasticsearch | awk '{print $1}'`

推荐阅读:
https://www.elastic.co/guide/en/elasticsearch/reference/7.17/advanced-configuration.html#set-jvm-heap-size

4.ES 启动脚本编写

1
2
3
4
5
6
7
8
9
10
11
12
13
14
15
16
17
18
19
$ cat > /usr/lib/systemd/system/es.service <<EOF
[Unit]
Description=Oldboyedu linux80 ELK
After=network.target

[Service]
Type=forking
ExecStart=/oldboyedu/softwares/es/bin/elasticsearch -d
Restart=no
User=oldboyedu
Group=oldboyedu
LimitNOFILE=131070

[Install]
WantedBy=multi-user.target
EOF

$ systemctl daemon-reload
$ systemctl restart es

5.部署 ES 集群

1
2
3
4
5
6
7
8
9
10
11
12
13
14
15
16
17
18
19
20
21
22
23
24
25
26
27
28
29
30
31
32
33
34
35
36
37
38
# (1)停⽌ES服务并删除集群之前的数据(如果是ES集群扩容就别删除数据了,我这⾥是部署⼀个"⼲净"的集群)
systemctl stop es
rm -rf /oldboyedu/softwares/es/{data,logs} /tmp/*
install -o oldboyedu -g oldboyedu -d /oldboyedu/softwares/es/logs

# (2)创建数据和⽇志⽬录
mkdir -pv /oldboyedu/{data,logs}
install -d /oldboyedu/{data,logs}/es7 -o oldboyedu -g oldboyedu

# (3)修改配置⽂件
vim /oldboyedu/softwares/es/config/elasticsearch.yml
...
cluster.name: oldboyedu-linux80-elk
path.data: /oldboyedu/data/es7
path.logs: /oldboyedu/logs/es7
network.host: 0.0.0.0
discovery.seed_hosts: ["10.0.0.101","10.0.0.102","10.0.0.103"]
cluster.initial_master_nodes: ["10.0.0.101","10.0.0.102","10.0.0.103"]

# (4)elk101节点同步数据到其他节点
data_rsync.sh /oldboyedu/
data_rsync.sh /etc/security/limits.d/elk.conf
data_rsync.sh /etc/sysctl.d/elk.conf
data_rsync.sh /usr/lib/systemd/system/es.service
data_rsync.sh /etc/profile.d/elk.sh

# (5)其他节点重连会话后执⾏以下操作
useradd oldboyedu
sysctl -f /etc/sysctl.d/elk.conf
sysctl -q vm.max_map_count
systemctl daemon-reload

# (6)启动ES集群
systemctl start es

# (7)验证ES的集群服务是否正常
curl 10.0.0.101:9200
curl 10.0.0.101:9200/_cat/nodes

6.部署 kibana 服务

1
2
3
4
5
6
7
8
9
10
11
12
13
14
15
16
17
18
19
20
21
22
23
24
25
26
27
# (1)解压软件包
tar xf kibana-7.17.3-linux-x86_64.tar.gz -C /oldboyedu/softwares/

# (2)创建符号链接
cd /oldboyedu/softwares/ && ln -sv kibana-7.17.3-linux-x86_64 kibana

# (3)配置环境变量
cat >> /etc/profile.d/elk.sh <<EOF
export KIBANA_HOME=/oldboyedu/softwares/kibana
export PATH=$PATH:$KIBANA_HOME/bin
EOF

source /etc/profile.d/elk.sh

# (4)修改⽂件全选
chown oldboyedu:oldboyedu -R /oldboyedu/softwares/kibana-7.17.3-linux-x86_64/

# (5)修改配置⽂件
vim /oldboyedu/softwares/kibana/config/kibana.yml
...
server.host: "0.0.0.0"
server.name: "oldboyedu-linux80-kibana"
elasticsearch.hosts: ["http://10.0.0.101:9200","http://10.0.0.102:9200","http://10.0.0.103:9200"]
i18n.locale: "zh-CN"

# (6)启动服务
su -c "kibana" oldboyedu

7.部署 logstash

1
2
3
4
5
6
7
8
9
10
11
12
13
14
15
16
17
18
19
20
21
22
23
24
25
26
# (1)解压logstash
tar xf logstash-7.17.3-linux-x86_64.tar.gz -C /oldboyedu/softwares/

# (2)创建符号链接
cd /oldboyedu/softwares/ && ln -sv logstash-7.17.3 logstsash

# (3)配置环境变量
cat >> /etc/profile.d/elk.sh <<EOF
export LOGSTASH_HOME=/oldboyedu/softwares/logstsash
export PATH=$PATH:$LOGSTASH_HOME/bin
EOF

source /etc/profile.d/elk.sh

# (4)编写测试案例
cat > conf-logstash/01-stdin-to-stdout.conf <<EOF
input {
stdin {}
}
output{
stdout {}
}
EOF

# (5)运⾏测试案例
logstash -f conf-logstash/01-stdin-to-stdout.conf

7.部署 filebeat

1
2
3
4
5
6
7
8
9
10
11
12
13
14
15
# (1)解压软件包
tar xf filebeat-7.17.3-linux-x86_64.tar.gz -C /oldboyedu/softwares/
cd /oldboyedu/softwares/filebeat-7.17.3-linux-x86_64
mkdir config-filebeat

# (2)编写配置⽂件
cat > config-filebeat/01-stdin-to-console.yml <EOF
filebeat.inputs:
- type: stdin
output.console:
pretty: true
EOF

# (3)启动filebeat实例
./filebeat -e -c config-filebeat/01-stdin-to-console.yml

8.部署 es-head 插件

1
2
3
4
5
(1)解压es-head组件的软件包
unzip es-head-0.1.4_0.crx.zip

(2)⾕歌浏览器导⼊软件包
设置 ---> 扩展程序 ---> 勾选"开发者模式" ---> "加载已经解压的扩展程序" ---> 选择"上⼀步骤解压的⽬录"

9.部署 postman 组件

1
2
3
4
5
(1)下载postman组件
https://www.postman.com/downloads/

(2)post的使⽤
后续讲解。

10.今⽇作业

1
2
3
4
5
(1)完成课堂的所有练习
(2)完善kibana的启动脚本,使⽤systemctl⼯具管理kibana并设置为开机⾃启动;

进阶作业:
调研logstash的多pipline编写。

ElasticSearch 的 Restful 风格 API 实战

1.Restful 及 JSON 格式

数据类型 描述 举例
字符串 要求使⽤双引号(””)引起来的数据 “oldboyedu”
数字 通常指的是 0-9 的所有数字。 100
布尔值 只有 true 和 false 两个值 true
空值 只有 null 一个值 null
数组 使⽤⼀对中括号(”[]”)放⼊不同的元素(⽀持⾼级数据类型和基础数据类型) [“linux”,100,false]
对象 使⽤⼀对⼤括号(”{}”)扩起来,⾥⾯的数据使⽤ KEY-VALUE 键值对即可。 {“class”:”linux80”,”age”:25}
1
2
3
4
5
6
7
8
9
10
11
12
13
14
15
16
17
18
19
20
21
22
23
24
25
26
27
28
29
30
31
32
Restful⻛格程序:
RESTFUL是⼀种⽹络应⽤程序的设计⻛格和开发⽅式,基于HTTP,可以使⽤XML格式定义或
JSON格式定义。
REST(英⽂:Representational State Transfer,简称REST)描述了⼀个架构样式的⽹络系统,⽐如 web 应⽤程序。
REST⾸次出现在2000年Roy Fielding的博⼠论⽂中,Roy Fielding是HTTP规范的主要编写者之⼀。

JSON语法:
基础数据类型:
字符串:
"oldboyedu"
"⽼男孩IT教育"
"2022"
""
数字:
0
1
2
...
布尔值:
true
false
空值:
null

⾼级数据类型:
数组:
["oldboyedu","沙河",2022,null,true,{"school":"oldboyedu","class":"linux80"}]
对象:
{"name":"oldboy", "age":40, "address":"北京沙河", "hobby":["Linux","思想课"],"other":null}

课堂练习:
使⽤json格式记录你的名字(name),年龄(age),学校(school),爱好(hobby),地址(address)。

2.ElasticSearch 的相关术语

1
2
3
4
5
6
7
8
9
10
11
12
13
14
15
16
17
18
19
20
21
Document:
即⽂档,是⽤户存储在ES的⼀些数据,它是ES中最⼩的存储单元。换句话说,⼀个⽂档是不可被拆分的。
⼀个⽂档使⽤的是json的对象数据类型存储。
filed:
相当于数据库表的字段,对⽂档数据根据不同属性进⾏分类标示。
index:
即索引,⼀个索引就是⼀个拥有相似特征⽂档的集合。
shard:
即分⽚,是真正存储数据的地⽅,每个分⽚底层对应的是⼀个Lucene库。⼀个索引⾄少有1个或多个分⽚。
replica:
即副本,是对数据的备份,⼀个分⽚可以有0个或多个副本。
⼀旦副本数量不为0,就会引⼊主分⽚(primary shard)和副本分⽚(replica shard)的概念。
主分⽚(primary shard):
可以实现数据的读写操作。
副本分⽚(replica shard):
可以实现数据读操作,与此同时,需要去主分⽚同步数据,当主分⽚挂掉,副本分⽚会变为主分⽚。
Allocation:
即分配,将分⽚(shard)分配给某个节点的过程,包括主分⽚和副本分⽚。
如果是副本分⽚,还包含从主分⽚复制数据的过程,这个分配过程由master节点调度完成。
Type:
在es 5.x即更早的版本,在⼀个索引中,我们可以定义⼀种或多种数据类型。但在es7仅⽀持"_doc"类型。

3.管理索引的 API

3.1 查看索引信息

1
2
3
4
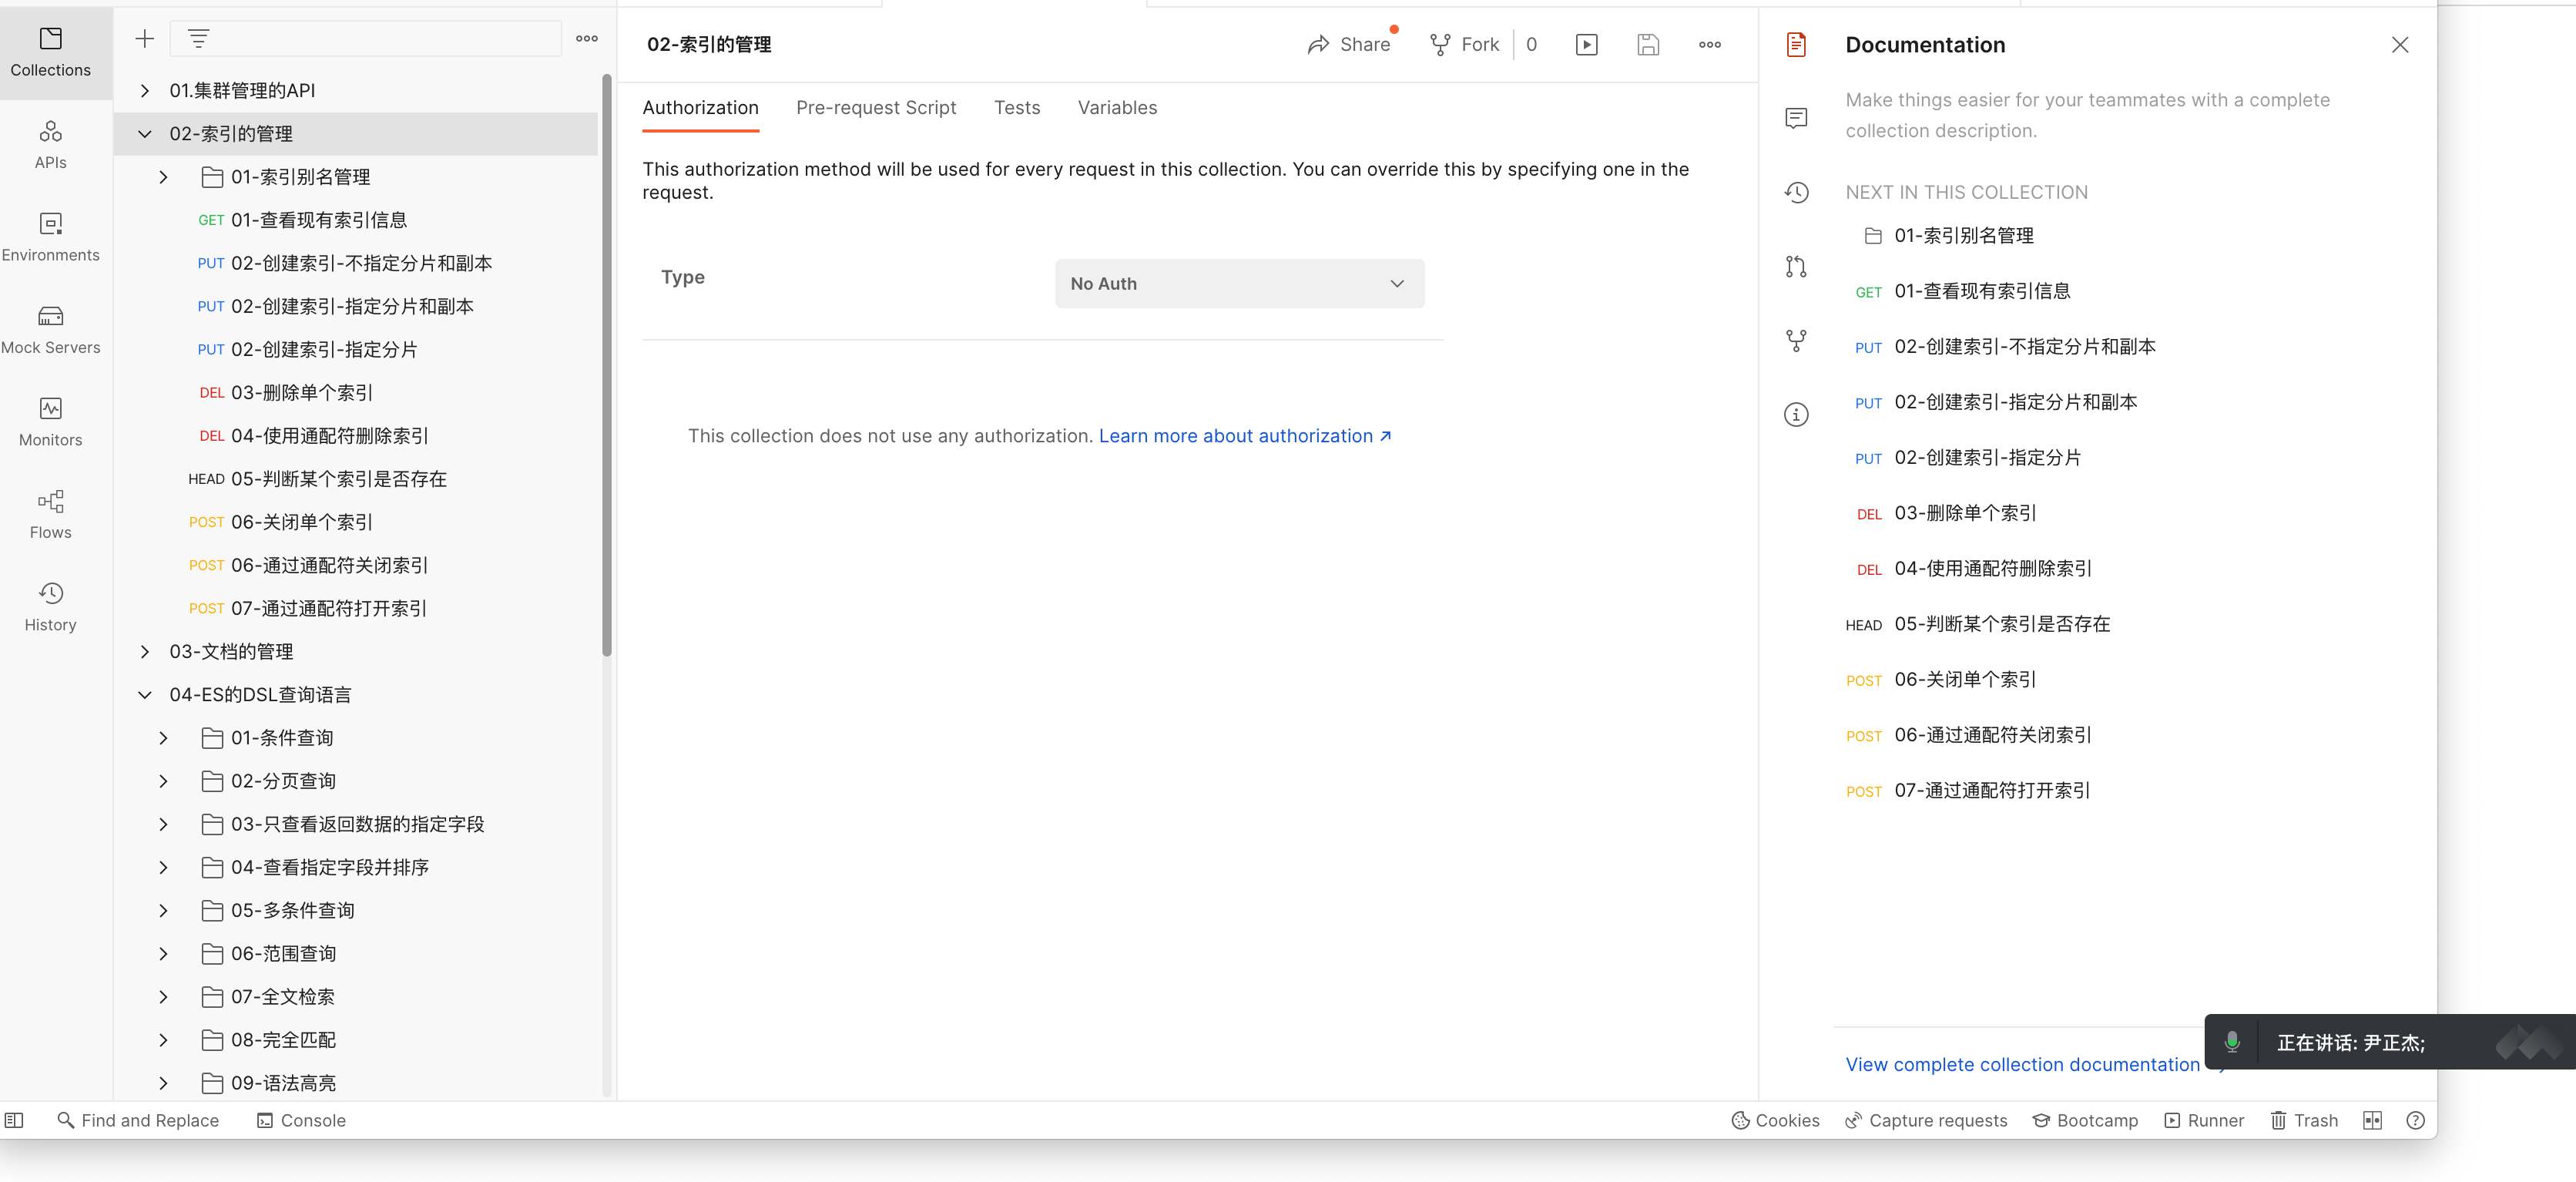
GET http://10.0.0.101:9200/_cat/indices  # 查看全部的索引信息
GET http://10.0.0.101:9200/_cat/indices?v # 查看表头信息
GET http://10.0.0.101:9200/_cat/indices/.kibana_7.17.3_001?v # 查看单个索引
GET http://10.0.0.101:9200/.kibana_7.17.3_001 # 查看单个索引的详细信息

3.2 创建索引

1
2
3
4
5
6
7
8
9
10
11
12
13
PUT http://10.0.0.101:9200/oldboyedu-linux82 # 创建索引并指定分⽚和副本
{
"settings": {
"index": {
"number_of_shards": "3",
"number_of_replicas": 0
}
}
}

参数说明:
"number_of_shards": 指定分⽚数量。
"number_of_replicas": 指定副本数量。

3.3 修改索引

1
2
3
4
5
6
7
PUT http://10.0.0.101:9200/oldboyedu-linux80/_settings
{
"number_of_replicas": 0
}

温馨提示:
分⽚数量⽆法修改,副本数量是可以修改的。

3.4 删除索引

1
2
3
4
DELETE http://10.0.0.101:9200/oldboyedu-linux80

温馨提示:
删除索引,服务器的数据也会随之删除哟!

3.5 索引别名

1
2
3
4
5
6
7
8
9
10
11
12
13
14
15
16
17
18
19
20
21
22
23
24
25
26
27
28
29
30
31
32
33
34
35
36
37
38
39
40
41
42
43
44
45
46
47
48
49
POST http://10.0.0.101:9200/_aliases  # 添加索引别名
{
"actions": [
{
"add": {
"index": "oldboyedu-linux80",
"alias": "Linux容器运维"
}
},
{
"add": {
"index": "oldboyedu-linux82",
"alias": "DBA"
}
}
]
}

GET http://10.0.0.101:9200/_aliases # 查看索引别名

POST http://10.0.0.101:9200/_aliases # 删除索引别名
{
"actions": [
{
"remove": {
"index": "oldboyedu-linux80",
"alias": "Linux容器运维"
}
}
]
}

POST http://10.0.0.101:9200/_aliases # 修改索引别名
{
"actions": [
{
"remove": {
"index": "oldboyedu-linux82",
"alias": "DBA"
}
},
{
"add": {
"index": "oldboyedu-linux82",
"alias": "SRE"
}
}
]
}

3.6 索引关闭

1
2
3
4
5
POST http://10.0.0.101:9200/oldboyedu-linux80/_close # 关闭索引
POST http://10.0.0.101:9200/oldboyedu-*/_close # 基于通配符关闭索引

温馨提示:
索引关闭意味着该索引⽆法进⾏任何的读写操作,但数据并不会被删除。

3.7 索引打开

1
2
POST http://10.0.0.101:9200/oldboyedu-linux80/_open  # 打开索引
POST http://10.0.0.101:9200/oldboyedu-*/_open # 基于通配符打开索引

3.8 索引的其他操作

推荐阅读: https://www.elastic.co/guide/en/elasticsearch/reference/current/indices.html

4.管理文档的 API

4.1 文档的创建

1
2
3
4
5
6
7
8
9
10
11
12
13
14
15
16
POST http://10.0.0.101:9200/teacher/_doc # 创建⽂档不指定"_id"
{
"name": "oldboy",
"hobby": [
"Linux",
"思想课"
]
}

POST http://10.0.0.101:9200/student/_doc/1003 # 创建⽂档并指定ID
{
"name": "苍⽼师",
"hobby": [
"家庭主妇"
]
}

4.2 文档的查看

1
2
3
4
5
6
7
8
9
GET http://10.0.0.101:9200/teacher/_search # 查看所有的⽂档
GET http://10.0.0.101:9200/teacher/_doc/4FHB0IABf2fC857QLdH6 # 查看某⼀个⽂档
HEAD http://10.0.0.101:9200/teacher/_doc/4FHB0IABf2fC857QLdH6 # 判断某⼀个⽂档是否存在,返回200,404.

温馨提示:
源数据:
指的是⽤户写⼊的数据。
元数据:
指的是描述数据的数据,由ES内部维护。

4.3 文档的修改

1
2
3
4
5
6
7
8
9
10
11
12
13
14
15
16
POST http://10.0.0.101:9200/teacher/_doc/4FHB0IABf2fC857QLdH6 # 全量更新,会覆盖原有的⽂档数据内容。
{
"name": "oldboy",
"hobby": [
"Linux",
"思想课",
"抖⾳"
]
}
POST http://10.0.0.101:9200/teacher/_doc/4FHB0IABf2fC857QLdH6/_update # 局部更新,并不会覆盖原有的数据。
{
"doc":{
"name": "⽼男孩",
"age": 45
}
}

4.4 文档的删除

1
DELETE http://10.0.0.101:9200/teacher/_doc/1001

4.5 文档的批量操作

1
2
3
4
5
6
7
8
9
10
11
12
13
14
15
16
17
18
19
20
21
22
23
24
25
26
27
28
29
30
31
POST http://10.0.0.101:9200/_bulk # 批量创建
{ "create": { "_index": "oldboyedu-linux80-elk"} }
{ "name": "oldboy","hobby":["Linux","思想课"] }
{ "create": { "_index": "oldboyedu-linux80-elk","_id": 1002} }
{ "name": "振亚","hobby":["妹⼦","吃⾯"] }
{ "create": { "_index": "oldboyedu-linux80-elk","_id": 1001} }
{ "name": "苍⽼师","hobby":["家庭主妇"] }

POST http://10.0.0.101:9200/_bulk # 批量删除
{ "delete" : { "_index" : "oldboyedu-linux80-elk", "_id" : "1001" } }
{ "delete" : { "_index" : "oldboyedu-linux80-elk", "_id" : "1002" } }

POST http://10.0.0.101:9200/_bulk # 批量修改
{ "update" : {"_id" : "1001", "_index" : "oldboyedu-linux80-elk"} }
{ "doc" : {"name" : "CangLaoShi"} }
{ "update" : {"_id" : "1002", "_index" : "oldboyedu-linux80-elk"} }
{ "doc" : {"name" : "ZhenYa"} }

POST http://10.0.0.101:9200/_mget # 批量查看
{
"docs": [
{
"_index": "oldboyedu-linux80-elk",
"_id": "1001"
},
{
"_index": "oldboyedu-linux80-elk",
"_id": "1002"
}
]
}

温馨提示: 对于⽂档的批量写操作,需要使⽤_bulk的 API,⽽对于批量的读操作,需要使⽤_mget的 API。

参考链接:

https://www.elastic.co/guide/en/elasticsearch/reference/7.17/docs-bulk.html
https://www.elastic.co/guide/en/elasticsearch/reference/7.17/docs-multi-get.html

4.6 课堂的练习

将下⾯的数据存储到 ES 集群:

1
2
3
{"name":"oldboy","hobby":["Linux","思想课"]}
{"name":"振亚","hobby":["妹⼦","吃⾯"]}
{"name":"苍⽼师","hobby":["家庭主妇"]}

5.使用映射(mapping)自定义数据类型

5.1 映射的数据类型

当写⼊⽂档时,字段的数据类型会被 ES 动态⾃动创建,但有的时候动态创建的类型并符合我们的需求。这个时候就可以使⽤映射解决。

使⽤映射技术,可以对 ES ⽂档的字段类型提前定义我们期望的数据类型,便于后期的处理和搜索。

  • text: 全⽂检索,可以被全⽂匹配,即该字段是可以被拆分的。
  • keyword: 精确匹配,必须和内容完全匹配,才能被查询出来。
  • ip: ⽀持 Ipv4 和 Ipv6,将来可以对该字段类型进⾏ IP 地址范围搜索。

参考链接:

https://www.elastic.co/guide/en/elasticsearch/reference/7.17/mapping.html

https://www.elastic.co/guide/en/elasticsearch/reference/7.17/mapping-types.html

5.2 IP 案例

1
2
3
4
5
6
7
8
9
10
11
12
13
14
15
16
17
18
19
20
21
22
23
24
25
26
27
28
29
30
31
PUT http://10.0.0.101:9200/oldboyedu-linux80-elk # 创建索引时指定映射关系
{
"mappings" :{
"properties": {
"ip_addr" : {
"type": "ip"
}
}
}
}

GET http://10.0.0.101:9200/oldboyedu-linux80-elk # 查看索引的映射关系

POST http://10.0.0.101:9200/_bulk # 创建测试数据
{ "create": { "_index": "oldboyedu-linux80-elk"} }
{ "ip_addr": "192.168.10.101" }
{ "create": { "_index": "oldboyedu-linux80-elk"} }
{ "ip_addr": "192.168.10.201" }
{ "create": { "_index": "oldboyedu-linux80-elk"} }
{ "ip_addr": "172.31.10.100" }
{ "create": { "_index": "oldboyedu-linux80-elk"} }
{ "ip_addr": "10.0.0.222" }

GET http://10.0.0.101:9200/oldboyedu-linux80-elk/_search # 查看IP的⽹断
{
"query": {
"match" : {
"ip_addr": "192.168.0.0/16"
}
}
}

5.3 其他类型类型案例

1
2
3
4
5
6
7
8
9
10
11
12
13
14
15
16
17
18
19
20
21
22
23
24
25
26
27
28
29
30
31
32
33
34
35
36
37
38
39
40
41
42
43
44
45
46
47
48
49
50
51
52
53
54
55
56
57
58
59
60
61
62
63
64
65
66
67
68
69
70
71
72
73
74
75
76
77
78
79
80
81
82
83
84
PUT http://10.0.0.101:9200/oldboyedu-linux80-elk-2022 # 创建索引

GET http://10.0.0.101:9200/oldboyedu-linux80-elk-2022# 查看索引信息

PUT http://10.0.0.101:9200/oldboyedu-linux80-elk-2022/_mapping # 为已创建的索引修改数据类型
{
"properties": {
"name": {
"type": "text",
"index": true
},
"gender": {
"type": "keyword",
"index": true
},
"telephone": {
"type": "text",
"index": false
},
"address": {
"type": "keyword",
"index": false
},
"email": {
"type": "keyword"
},
"ip_addr": {
"type": "ip"
}
}
}

POST http://10.0.0.101:9200/_bulk # 添加测试数据
{ "create": { "_index": "oldboyedu-linux80-elk-2022"} }
{ "ip_addr": "192.168.10.101" ,"name": "柳鹏","gender":"男性的","telephone":"33333333","address":"沙河","email":"liupeng@oldboyedu.com"}
{ "create": { "_index": "oldboyedu-linux80-elk-2022"} }
{ "ip_addr": "192.168.20.21" ,"name": "王岩","gender":"男性的","telephone":"55555","address":"松兰堡","email":"wangyan@oldboyedu.com"}
{ "create": { "_index": "oldboyedu-linux80-elk-2022"} }
{ "ip_addr": "172.28.30.101" ,"name": "赵嘉欣","gender":"⼥性的","telephone":"33333333","address":"于⾟庄","email":"zhaojiaxin@oldboyedu.com"}
{ "create": { "_index": "oldboyedu-linux80-elk-2022"} }
{ "ip_addr": "172.28.50.121" ,"name": "庞冉","gender":"⼥性的","telephone":"444444444","address":"于⾟庄","email":"pangran@oldboyedu.com"}
{ "create": { "_index": "oldboyedu-linux80-elk-2022"} }
{ "ip_addr": "10.0.0.67" ,"name": "王浩任","gender":"男性的","telephone":"22222222","address":"松兰堡","email":"wanghaoren@oldboyedu.com"}

GET http://10.0.0.101:9200/oldboyedu-linux80-elk-2022/_search # 基于gender字段搜索
{
"query":{
"match":{
"gender": "⼥"
}
}
}
GET http://10.0.0.101:9200/oldboyedu-linux80-elk-2022/_search # 基于name字段搜索
{
"query":{
"match":{
"name": "王"
}
}
}
GET http://10.0.0.101:9200/oldboyedu-linux80-elk-2022/_search # 基于email字段搜索
{
"query":{
"match":{
"email": "pangran@oldboyedu.com"
}
}
}
GET http://10.0.0.101:9200/oldboyedu-linux80-elk-2022/_search # 基于ip_addr字段搜索
{
"query": {
"match" : {
"ip_addr": "192.168.0.0/16"
}
}
}
GET http://10.0.0.101:9200/oldboyedu-linux80-elk-2022/_search # 基于address字段搜索,⽆法完成。
{
"query":{
"match":{
"address": "松兰堡"
}
}
}

6. IK 中文分词器

6.1 内置的标准分词器 - 分析英文

1
2
3
4
5
GET http://10.0.0.101:9200/_analyze
{
"analyzer": "standard",
"text": "My name is Jason Yin, and I'm 18 years old !"
}

温馨提示: 标准分词器模式使⽤空格和符号进⾏切割分词的。

6.2 内置的标准分词器 - 分析中文并不友好

1
2
3
4
5
GET http://10.0.0.101:9200/_analyze
{
"analyzer": "standard",
"text": "我爱北京天安⻔!"
}

温馨提示: 标准分词器默认使⽤单个汉⼦进⾏切割,很明显,并不符合我们国内的使⽤习惯。

6.3 安装 IK 分词器

下载地址: https://github.com/medcl/elasticsearch-analysis-ik

安装 IK 分词器:

1
2
3
4
5
install -d /oldboyedu/softwares/es/plugins/ik -o oldboyedu -g oldboyed
cd /oldboyedu/softwares/es/plugins/ik
unzip elasticsearch-analysis-ik-7.17.3.zip
rm -f elasticsearch-analysis-ik-7.17.3.zip
chown -R oldboyedu:oldboyedu *

重启 ES 节点,使之加载插件:

1
systemctl restart es

测试 IK 分词器:

1
2
3
4
5
6
7
8
9
10
11
GET http://10.0.0.101:9200/_analyze  # 细粒度拆分
{
"analyzer": "ik_max_word",
"text": "我爱北京天安⻔!"
}

GET http://10.0.0.101:9200/_analyze # 粗粒度拆分
{
"analyzer": "ik_smart",
"text": "我爱北京天安⻔!"
}

6.4 自定义 IK 分词器的字典

1
2
3
4
5
6
7
8
9
10
11
12
13
14
15
16
17
18
19
20
21
22
23
24
25
26
27
# (1)进⼊到IK分词器的插件安装⽬录
cd /oldboyedu/softwares/es/plugins/ik/config

# (2)⾃定义字典
cat > oldboyedu-linux80.dic <<EOF
上号
德玛⻄亚
艾欧尼亚
亚索
EOF

chown oldboyedu:oldboyedu oldboyedu-linux80.dic

# (3)加载⾃定义字典
vim IKAnalyzer.cfg.xml
...
<entry key="ext_dict">oldboyedu-linux80.dic</entry>

# (4)重启ES集群
systemctl restart es

# (5)测试分词器
GET http://10.0.0.101:9200/_analyze
{
"analyzer": "ik_smart",
"text": "嗨,哥们! 上号,我德玛⻄亚和艾欧尼亚都有号! 我亚索贼6,肯定能带你⻜!!!"
}

6.5 自定义分词器 - 了解即可

1
2
3
4
5
6
7
8
9
10
11
12
13
14
15
16
17
18
19
20
21
22
23
24
25
26
27
28
29
30
31
32
33
34
35
# (1)⾃定义分词器
PUT http://10.0.0.101:9200/oldboyedu_linux80_2022
{
"settings":{
"analysis":{
"char_filter":{
"&_to_and":{
"type": "mapping",
"mappings": ["& => and"]
}
},
"filter":{
"my_stopwords":{
"type":"stop",
"stopwords":["the","a","if","are","to","be","kind"]
}
},
"analyzer":{
"my_analyzer":{
"type":"custom",
"char_filter":["html_strip","&_to_and"],
"tokenizer": "standard",
"filter":["lowercase","my_stopwords"]
}
}
}
}
}

# (2)验证置⾃定义分词器是否⽣效
GET http://10.0.0.101:9200/oldboyedu_linux80_2022/_analyze
{
"text":"If you are a PERSON, Please be kind to small Animals.",
"analyzer":"my_analyzer"
}

7. 今日作业

1
2
3
(1)将"shopping.json"⽂件的内容使⽤"_bulk"的API批量写⼊ES集群,要求索引名称为"oldboyedu-shopping";

(2)每⼈收集10条数据并写⼊ES集群,索引名称为"oldboyedu-linux80"

7.1 shopping.json

1
2
3
4
5
6
7
8
9
10
11
12
13
14
15
16
17
18
19
20
21
22
23
24
25
26
27
28
29
30
31
32
33
34
35
36
37
38
39
40
41
42
43
44
45
46
47
48
49
50
51
52
53
54
55
56
57
58
59
60
61
62
63
64
65
66
67
68
69
70
71
72
73
74
75
76
77
78
79
80
81
82
83
84
85
86
87
88
89
90
91
92
93
94
95
96
97
98
99
100
101
102
103
104
105
106
107
108
109
110
111
112
113
114
115
116
117
118
119
120
121
122
123
124
125
126
127
128
129
130
131
132
133
134
135
136
137
138
139
140
141
142
143
144
145
146
147
148
149
150
151
152
153
154
155
156
157
158
159
160
161
162
163
164
165
166
167
168
169
170
171
172
173
174
175
176
177
178
179
180
181
182
183
184
185
186
187
188
189
190
191
192
193
194
195
196
197
198
199
200
201
202
203
204
205
206
207
208
209
210
211
212
213
214
215
216
217
{
"title": "戴尔(DELL)31.5英⼨ 4K 曲⾯ 内置⾳箱 低蓝光 影院级⾊彩 FreeSync技术 可壁挂 1800R 电脑显示器 S3221QS",
"price": 3399.00,
"brand": "Dell",
"weight": "15.25kg",
"item": "https://item.jd.com/100014940686.html"
},
{
"title": "三星(SAMSUNG)28英⼨ 4K IPS 10.7亿⾊ 90%DCI-P3 Eyecomfort2.0认证 专业设计制图显示器(U28R550UQC)",
"price": 2099.00,
"brand": "SAMSUNG",
"weight": "7.55kg",
"item": "https://item.jd.com/100009558656.html"
},
{
"title": "ALIENWARE外星⼈新品外设⾼端键⿏套装AW510K机械键盘cherry轴RGB/AW610M 610M ⽆线⿏标+510K机械键盘+510H⽿机",
"price": 6000.00,
"brand": "ALIENWARE外星⼈",
"weight": "1.0kg",
"item": "https://item.jd.com/10030370257612.html"
},
{
"title": "樱桃CHERRY MX8.0彩光87键游戏机械键盘合⾦⼥⽣樱粉⾊版 彩光-粉⾊红轴-粉⾊箱 官⽅标配",
"price": 4066.00,
"brand": "樱桃CHERRY",
"weight": "1.0kg",
"item": "https://item.jd.com/10024385308012.html"
},
{
"title": "罗技(G)G610机械键盘 有线机械键盘 游戏机械键盘 全尺⼨背光机械键盘 吃鸡键盘 Cherry红轴",
"price": 429.00,
"brand": "罗技",
"weight": "1.627kg",
"item": "https://item.jd.com/3378484.html"
},
{
"title": "美商海盗船(USCORSAIR)K68机械键盘⿊⾊ 防⽔防尘樱桃轴体 炫彩背光游戏有线 红光红轴",
"price": 499.00,
"brand": "美商海盗船",
"weight": "1.41kg",
"item": "https://item.jd.com/43580479783.html"
},
{
"title": "雷蛇(Razer) 蝰蛇标准版 ⿏标 有线⿏标 游戏⿏标 ⼈体⼯程学 电竞 ⿊⾊6400DPI lol吃鸡神器cf",
"price": 109.00,
"brand": "雷蛇",
"weight": "185.00g",
"item": "https://item.jd.com/8141909.html"
},
{
"title": "罗技(G)G502 HERO主宰者有线⿏标 游戏⿏标 HERO引擎 RGB⿏标 电竞⿏标 25600DPI",
"price": 299.00,
"brand": "罗技",
"weight": "250.00g",
"item": "https://item.jd.com/100001691967.html"
},
{
"title": "武极 i5 10400F/GTX1050Ti/256G游戏台式办公电脑主机DIY组装机",
"price": 4099.00,
"brand": "武极",
"weight": "5.0kg",
"item": "https://item.jd.com/1239166056.html"
},
{
"title": "变异者 组装电脑主机DIY台式游戏 i5 9400F/16G/GTX1050Ti 战胜G1",
"price": 4299.00,
"brand": "变异者",
"weight": "9.61kg",
"item": "https://item.jd.com/41842373306.html"
},
{
"title": "宏碁(Acer) 暗影骑⼠·威N50-N92 英特尔酷睿i5游戏台机 吃鸡电脑主机(⼗⼀代i5-11400F 16G 256G+1T GTX1650)",
"price": 5299.00,
"brand": "宏碁",
"weight": "7.25kg",
"item": "https://item.jd.com/100020726324.html"
},
{
"title": "京天 酷睿i7 10700F/RTX2060/16G内存 吃鸡游戏台式电脑主机DIY组装机",
"price": 7999.00,
"brand": "京天",
"weight": "10.0kg",
"item": "https://item.jd.com/40808512828.html"
},
{
"title": "戴尔(DELL)OptiPlex 3070MFF/3080MFF微型台式机电脑迷你⼩主机客厅HTPC 标配 i5-10500T/8G/1T+256G 内置WiFi+蓝⽛ 全国联保 三年上⻔",
"price": 3999.00,
"brand": "DELL",
"weight": "2.85kg",
"item": "https://item.jd.com/10025304273651.html"
},
{
"title": "伊萌纯种英短蓝⽩猫活体猫咪幼猫活体英国短⽑猫矮脚猫英短蓝猫幼体银渐层蓝⽩活体宠物蓝猫幼崽猫咪宠物猫短 双⾎统A级 ⺟",
"price": 4000.00,
"brand": "英短",
"weight": "1.0kg",
"item": "https://item.jd.com/10027188382742.html"
},
{
"title": "柴墨 ⾦渐层幼猫英短猫宠物猫英短⾦渐层猫咪活体猫活体纯种⼩猫银渐层 双⾎统",
"price": 12000.00,
"brand": "英短",
"weight": "3.0kg",
"item": "https://item.jd.com/10029312412476.html"
},
{
"title": "Redmi Note10 Pro 游戏智能5G⼿机 ⼩⽶ 红⽶",
"price": 9999.00,
"brand": "⼩⽶",
"weight": "10.00g",
"item": "https://item.jd.com/100021970002.html"
},
{
"title": "【⼆⼿99新】⼩⽶Max3⼿机⼆⼿⼿机 ⼤屏安卓 曜⽯⿊ 6G+128G 全⽹通",
"price": 1046.00,
"brand": "⼩⽶",
"weight": "0.75kg",
"item": "https://item.jd.com/35569092038.html"
},
{
"title": "现货速发(10天价保)⼩⽶11 5G⼿机 骁⻰888 游戏智能⼿机 PRO店内可选⿊⾊ 套装版 12GB+256GB",
"price": 4699.00,
"brand": "⼩⽶",
"weight": "0.7kg",
"item": "https://item.jd.com/10025836790851.html"
},
{
"title": "⼩⽶⼿环6 NFC版 全⾯彩屏 30种运动模式 24h⼼率检测 50⽶防⽔ 智能⼿环",
"price": 279.00,
"brand": "⼩⽶",
"weight": "65.00g",
"item": "https://item.jd.com/100019867468.html"
},
{
"title": "HUAWEI MateView⽆线原⾊显示器⽆线版 28.2英⼨ 4K+ IPS 98% DCI-P310.7亿⾊ HDR400 TypeC 双扬声器 双MIC",
"price": 4699.00,
"brand": "华为",
"weight": "9.8kg",
"item": "https://item.jd.com/100021420806.html"
},
{
"title": "华为nova7se/nova7 se 5G⼿机( 12期免息可选 )下单享好礼 绮境森林乐活版 8G+128G(1年碎屏险)",
"price": 2999.00,
"brand": "华为",
"weight": "500.00g",
"item": "https://item.jd.com/10029312412476.html"
},
{
"title": "华为HUAWEI FreeBuds 4i主动降噪 ⼊⽿式真⽆线蓝⽛⽿机/通话降噪/⻓续航/⼩巧舒适 Android&ios通⽤ 陶瓷⽩",
"price": 479.00,
"brand": "华为",
"weight": "137.00g",
"item": "https://item.jd.com/100018510746.html"
},
{
"title": "HUAWEI WATCH GT2 华为⼿表 运动智能⼿表 两周⻓续航/蓝⽛通话/⾎氧检测/麒麟芯⽚ 华为gt2 46mm 曜⽯⿊",
"price": 1488.00,
"brand": "华为",
"weight": "335.00g",
"item": "https://item.jd.com/100008492922.html"
},
{
"title": "Apple苹果12 mini iPhone 12 mini 5G ⼿机(现货速发 12期免息可选)蓝⾊ 5G版 64G",
"price": 4699.00,
"brand": "苹果",
"weight": "280.00g",
"item": "https://item.jd.com/10026100075337.html"
},
{
"title": "Apple iPhone 12 (A2404) 128GB 紫⾊ ⽀持移动联通电信5G 双卡双待⼿机",
"price": 6799.00,
"brand": "苹果",
"weight": "330.00g",
"item": "https://item.jd.com/100011203359.html"
},
{
"title": "华硕ROG冰刃双屏 ⼗代英特尔酷睿 15.6英⼨液⾦导热300Hz电竞游戏笔记本电脑 i9-10980H 32G 2T RTX2080S",
"price": 48999.00,
"brand": "华硕",
"weight": "2.5kg",
"item": "https://item.jd.com/10021558215658.html"
},
{
"title": "联想⼩新Air15 2021超轻薄笔记本电脑 ⾼⾊域学⽣办公设计师游戏本 ⼋核锐⻰R7-5700U 16G内存 512G固态 升级15.6英⼨IPS全⾯屏【DC调光护眼⽆闪烁】",
"price": 5499.00,
"brand": "苹果",
"weight": "10.0kg",
"item": "https://item.jd.com/33950552707.html"
},
{
"title": "苹果(Apple)MacBook Air 13.3英⼨ 笔记本电脑 【2020款商务灰】⼗代i7 16G 512G 官⽅标配 19点前付款当天发货",
"price": 10498.00,
"brand": "苹果",
"weight": "1.29kg",
"item": "https://item.jd.com/10021130510120.html"
},
{
"title": "科⼤讯⻜机器⼈ 阿尔法蛋A10智能机器⼈ 专业教育⼈⼯智能编程机器⼈学习机智能可编程 ⽩⾊",
"price": 1099.00,
"brand": "科⼤讯⻜",
"weight": "1.7kg",
"item": "https://item.jd.com/100005324258.html"
},
{
"title": "robosen乐森机器⼈六⼀⼉童节礼物⾃营孩⼦玩具星际特⼯智能编程机器⼈⼉童语⾳控制陪伴益智变形机器⼈",
"price": 2499.00,
"brand": "senpowerT9-X",
"weight": "3.01kg",
"item": "https://item.jd.com/100006740372.html"
},
{
"title": "优必选(UBTECH)悟空智能语⾳监控对话⼈形机器⼈⼉童教育陪伴早教学习机玩具",
"price": 4999.00,
"brand": "优必选悟空",
"weigth": "1.21kg",
"item": "https://item.jd.com/100000722348.html"
}

7.2 oldboyedu-linux80.json

1
2
3
4
5
6
7
8
9
10
11
12
等你来完善...

要求如下:
(1)收集源数据,要求包含"title","price","brand","weigth","item","producer";
"title" 商品的标题。
"price" 商品的价格。
"brand" 商品的品牌。
"weigth" 商品的重量。
"item" 商品的链接。
"producer" 收集者姓名。

(2)要求使⽤ES的批量操作的API完成;
参考案例 1
1
2
3
4
5
6
7
8
9
10
11
12
13
14
15
16
17
18
19
20
21
22
23
24
25
26
27
28
29
30
31
POST http://10.0.0.103:9200/_bulk
{"create":{"_index":"oldboyedu-shopping"}}{"title":"戴尔(DELL)31.5英⼨ 4K 曲⾯ 内置⾳箱 低蓝光 影院级⾊彩 FreeSync技术 可壁挂 1800R 电脑显示器 S3221QS","price":3399.00,"brand":"Dell","weight":"15.25kg","item":"https://item.jd.com/100014940686.html"}
{"create":{"_index":"oldboyedu-shopping"}}{"title":"三星(SAMSUNG)28英⼨ 4K IPS 10.7亿⾊ 90%DCI-P3 Eyecomfort2.0认证 专业设计制图显示器(U28R550UQC)","price":2099.00,"brand":"SAMSUNG","weight":"7.55kg","item":"https://item.jd.com/100009558656.html"}
{"create":{"_index":"oldboyedu-shopping"}}{"title":"ALIENWARE外星⼈新品外设⾼端键⿏套装AW510K机械键盘cherry轴RGB/AW610M 610M ⽆线⿏标+510K机械键盘+510H⽿机","price":6000.00,"brand":"ALIENWARE外星⼈","weight":"1.0kg","item":"https://item.jd.com/10030370257612.html"}
{"create":{"_index":"oldboyedu-shopping"}}{"title":"樱桃CHERRY MX8.0彩光87键游戏机械键盘合⾦⼥⽣樱粉⾊版 彩光-粉⾊红轴-粉⾊箱 官⽅标配","price":4066.00,"brand":"樱桃CHERRY","weight":"1.0kg","item":"https://item.jd.com/10024385308012.html"}
{"create":{"_index":"oldboyedu-shopping"}}{"title":"罗技(G)G610机械键盘 有线机械键盘 游戏机械键盘 全尺⼨背光机械键盘 吃技","weight":"1.627kg","item":"https://item.jd.com/3378484.html"}
{"create":{"_index":"oldboyedu-shopping"}}{"title":"美商海盗船(USCORSAIR)K68机械键盘⿊⾊ 防⽔防尘樱桃轴体 炫彩背光游戏有线 红光红轴","price":499.00,"brand":"美商海盗船","weight":"1.41kg","item":"https://item.jd.com/43580479783.html"}
{"create":{"_index":"oldboyedu-shopping"}}{"title":"雷蛇(Razer) 蝰蛇标准版 ⿏标 有线⿏标 游戏⿏标 ⼈体⼯程学 电竞 ⿊⾊6400DPI lol吃鸡神器cf","price":109.00,"brand":"雷蛇","weight":"185.00g","item":"https://item.jd.com/8141909.html"}
{"create":{"_index":"oldboyedu-shopping"}}{"title":"罗技(G)G502 HERO主宰者有线⿏标 游戏⿏标 HERO引擎 RGB⿏标 电竞⿏标25600DPI","price":299.00,"brand":"罗技","weight":"250.00g","item":"https://item.jd.com/100001691967.html"}
{"create":{"_index":"oldboyedu-shopping"}}{"title":"武极 i5 10400F/GTX1050Ti/256G游戏台式办公电脑主机DIY组装机","price":4099.00,"brand":"武极","weight":"5.0kg","item":"https://item.jd.com/1239166056.html"}
{"create":{"_index":"oldboyedu-shopping"}}{"title":"宏碁(Acer) 暗影骑⼠·威N50-N92 英特尔酷睿i5游戏台机 吃鸡电脑主机(⼗⼀代i5-11400F 16G 256G+1T GTX1650)","price":5299.00,"brand":"宏碁","weight":"7.25kg","item":"https://item.jd.com/100020726324.html"}
{"create":{"_index":"oldboyedu-shopping"}}{"title":"京天 酷睿i7 10700F/RTX2060/16G内存 吃鸡游戏台式电脑主机DIY组装机","price":7999.00,"brand":"京天","weight":"10.0kg","item":"https://item.jd.com/40808512828.html"}
{"create":{"_index":"oldboyedu-shopping"}}{"title":"戴尔(DELL)OptiPlex 3070MFF/3080MFF微型台式机电脑迷你⼩主机客厅HTPC 标配 i5-10500T/8G/1T+256G 内置WiFi+蓝⽛ 全国联保 三年上⻔","price":3999.00,"brand":"DELL","weight":"2.85kg","item":"https://item.jd.com/10025304273651.html"}
{"create":{"_index":"oldboyedu-shopping"}}{"title":"伊萌纯种英短蓝⽩猫活体猫咪幼猫活体英国短⽑猫矮脚猫英短蓝猫幼体银渐层蓝⽩活体宠物蓝猫幼崽猫咪宠物猫短 双⾎统A级 ⺟","price":4000.00,"brand":"英短","weight":"1.0kg","item":"https://item.jd.com/10027188382742.html"}
{"create":{"_index":"oldboyedu-shopping"}}{"title":"柴墨 ⾦渐层幼猫英短猫宠物猫英短⾦渐层猫咪活体猫活体纯种⼩猫银渐层 双⾎统","price":12000.00,"brand":"英短","weight":"3.0kg","item":"https://item.jd.com/10029312412476.html"}
{"create":{"_index":"oldboyedu-shopping"}}{"title":"Redmi Note10 Pro 游戏智能5G⼿机 ⼩⽶ 红⽶","price":9999.00,"brand":"⼩⽶","weight":"10.00g","item":"https://item.jd.com/100021970002.html"}
{"create":{"_index":"oldboyedu-shopping"}}{"title":"【⼆⼿99新】⼩⽶Max3⼿机⼆⼿⼿机 ⼤屏安卓 曜⽯⿊ 6G+128G 全⽹通","price":1046.00,"brand":"⼩⽶","weight":"0.75kg","item":"https://item.jd.com/35569092038.html"}
{"create":{"_index":"oldboyedu-shopping"}}{"title":"现货速发(10天价保)⼩⽶11 5G⼿机 骁⻰888 游戏智能⼿机 PRO店内可选⿊⾊ 套装版 12GB+256GB","price":4699.00,"brand":"⼩⽶","weight":"0.75kg","item":"https://item.jd.com/10025836790851.html"}
{"create":{"_index":"oldboyedu-shopping"}}{"title":"⼩⽶⼿环6 NFC版 全⾯彩屏 30种运动模式 24h⼼率检测 50⽶防⽔ 智能⼿环","price":279.00,"brand":"⼩⽶","weight":"65.00g","item":"https://item.jd.com/100019867468.html"}
{"create":{"_index":"oldboyedu-shopping"}}{"title":"HUAWEI MateView⽆线原⾊显示器⽆线版 28.2英⼨ 4K+ IPS 98% DCI-P310.7亿⾊ HDR400 TypeC 双扬声器 双MIC","price":4699.00,"brand":"华为","weight":"9.8kg","item":"https://item.jd.com/100021420806.html"}
{"create":{"_index":"oldboyedu-shopping"}}{"title":"华为nova7se/nova7 se 5G⼿机( 12期免息可选 )下单享好礼 绮境森林 乐活版 8G+128G(1年碎屏险)","price":2999.00,"brand":"华为","weight":"500.00g","item":"https://item.jd.com/10029312412476.html"}
{"create":{"_index":"oldboyedu-shopping"}}{"title":"华为HUAWEI FreeBuds 4i主动降噪 ⼊⽿式真⽆线蓝⽛⽿机/通话降噪/⻓续航/⼩巧舒适 Android&ios通⽤ 陶瓷⽩","price":479.00,"brand":"华为","weight":"137.00g","item":"https://item.jd.com/100018510746.html"}
{"create":{"_index":"oldboyedu-shopping"}}{"title":"HUAWEI WATCH GT2 华为⼿表 运动智能⼿表 两周⻓续航/蓝⽛通话/⾎氧检测/麒麟芯⽚ 华为gt2 46mm 曜⽯⿊","price":1488.00,"brand":"华为","weight":"335.00g","item":"https://item.jd.com/100008492922.html"}
{"create":{"_index":"oldboyedu-shopping"}}{"title":"Apple苹果12 mini iPhone 12 mini 5G ⼿机(现货速发 12期免息可选)蓝⾊ 5G版 64G","price":4699.00,"brand":"苹果","weight":"280.00g","item":"https://item.jd.com/10026100075337.html"}
{"create":{"_index":"oldboyedu-shopping"}}{"title":"Apple iPhone 12 (A2404) 128GB 紫⾊ ⽀持移动联通电信5G 双卡双待⼿机","price":6799.00,"brand":"苹果","weight":"330.00g","item":"https://item.jd.com/100011203359.html"}
{"create":{"_index":"oldboyedu-shopping"}}{"title":"华硕ROG冰刃双屏 ⼗代英特尔酷睿 15.6英⼨液⾦导热300Hz电竞游戏笔记本电脑 i9-10980H 32G 2T RTX2080S","price":48999.00,"brand":"华硕","weight":"2.5kg","item":"https://item.jd.com/10021558215658.html"}
{"create":{"_index":"oldboyedu-shopping"}}{"title":"联想⼩新Air15 2021超轻薄笔记本电脑 ⾼⾊域学⽣办公设计师游戏本 ⼋核锐⻰R7-5700U 16G内存 512G固态 升级15.6英⼨IPS全⾯屏【DC调光护眼⽆闪烁】","price":5499.00,"brand":"苹果","weight":"10.0kg","item":"https://item.jd.com/33950552707.html"}
{"create":{"_index":"oldboyedu-shopping"}}{"title":"苹果(Apple)MacBook Air 13.3英⼨ 笔记本电脑 【2020款商务灰】⼗代i7 16G 512G 官⽅标配 19点前付款当天发货","price":10498.00,"brand":"苹果","weight":"1.29kg","item":"https://item.jd.com/10021130510120.html"}
{"create":{"_index":"oldboyedu-shopping"}}{"title":"科⼤讯⻜机器⼈ 阿尔法蛋A10智能机器⼈ 专业教育⼈⼯智能编程机器⼈学习机智能可编程 ⽩⾊","price":1099.00,"brand":"科⼤讯⻜","weight":"1.7kg","item":"https://item.jd.com/100005324258.html"}
{"create":{"_index":"oldboyedu-shopping"}}{"title":"robosen乐森机器⼈六⼀⼉童节礼物⾃营孩⼦玩具星际特⼯智能编程机器⼈⼉童语⾳控制陪伴益智变形机器⼈","price":2499.00,"brand":"senpowerT9-X","weight":"3.01kg","item":"https://item.jd.com/100006740372.html"}
{"create":{"_index":"oldboyedu-shopping"}}{"title":"优必选(UBTECH)悟空智能语⾳监控对话⼈形机器⼈⼉童教育陪伴早教学习机玩具","price":4999.00,"brand":"优必选悟空","weight":"1.21kg","item":"https://item.jd.com/100000722348.html"}
参考案例 2
1
2
3
4
5
6
7
8
9
10
11
12
13
14
15
16
17
18
19
20
21
22
23
24
25
26
27
28
29
30
31
32
33
34
35
# (1)启动filebeat
cat > config-filebeat/02-log-to-es.yml <<EOF
filebeat.inputs:
- type: log
paths:
- /tmp/shopping.json
json.keys_under_root: true

output.logstash:
hosts: ["10.0.0.101:8888"]
EOF
./filebeat -e -c config-filebeat/02-log-to-es.yml

# (2)启动logstash
cat > conf-logstash/02-beats-to-es.conf <<EOF
input {
beats {
port => 8888
}
}
filter {
mutate {
remove_field => ["host","@timestamp","tags","log","agent","@version", "input","ecs"]
}
}
output {
stdout {}
elasticsearch {
hosts => ["10.0.0.101:9200","10.0.0.102:9200","10.0.0.103:9200"]
index => "oldboyedu-linux80-shopping"
}
}
EOF

logstash -rf conf-logstash/02-beats-to-es.conf

索引模板

1.什么是索引模板

索引模板是创建索引的⼀种⽅式。
当数据写⼊指定索引时,如果该索引不存在,则根据索引名称匹配相应索引模板的话,会根据模板的配置⽽建⽴索引。
索引模板仅对新创建的索引⽣效,对已经创建的索引是没有任何作⽤的。
推荐阅读: https://www.elastic.co/guide/en/elasticsearch/reference/7.17/index-templates.html

2.查看索引模板

1
2
GET http://10.0.0.103:9200/_template      # 查看所有的索引模板
GET http://10.0.0.103:9200/_template/oldboyedu-linux80 # 查看单个索引模板

3.创建/修改索引模板

1
2
3
4
5
6
7
8
9
10
11
12
13
14
15
16
17
18
19
20
21
22
23
24
25
26
27
28
29
30
31
32
33
POST http://10.0.0.103:9200/_template/oldboyedu-linux80
{
"aliases": {
"DBA": {},
"SRE": {},
"K8S": {}
},
"index_patterns": [
"oldboyedu-linux80*"
],
"settings": {
"index": {
"number_of_shards": 3,
"number_of_replicas": 0
}
},
"mappings": {
"properties":{
"ip_addr": {
"type": "ip"
},
"access_time": {
"type": "date"
},
"address": {
"type" :"text"
},
"name": {
"type": "keyword"
}
}
}
}

4.删除索引模板

1
DELETE http://10.0.0.103:9200/_template/oldboyedu-linux80

ES 的 DSL 语句查询 - DBA 方向需要掌握!

1.什么是 DSL

Elasticsearch 提供了基于 JSON 的完整 Query DSL(Domain Specific Language,领域特定语⾔)来定义查询。

2.全文检索 - match 查询

1
2
3
4
5
6
7
8
9
10
11
POST http://10.0.0.103:9200/oldboyedu-shopping/_search
{
"query": {
"match" : {
"brand":"⼩苹华"
}
}
}

温馨提示:
查询品牌是"⼩苹华"的所有商品。背后的逻辑是会对中⽂进⾏分词。

3.完全匹配 - match_phrase 查询

1
2
3
4
5
6
7
8
9
10
11
POST http://10.0.0.103:9200/oldboyedu-shopping/_search
{
"query": {
"match_phrase" : {
"brand":"⼩苹华"
}
}
}

温馨提示:
查询品牌是"⼩苹华"的所有商品。背后的逻辑并不会对中⽂进⾏分词。

4.全量查询 - match_all

1
2
3
4
5
6
7
8
9
POST http://10.0.0.103:9200/oldboyedu-shopping/_search
{
"query": {
"match_all" : {}
}
}

温馨提示:
请求体的内容可以不写,即默认就是发起了全量查询(match_all)。

5.分页查询 - size-from

1
2
3
4
5
6
7
8
9
10
11
12
13
14
15
16
17
18
POST http://10.0.0.103:9200/oldboyedu-shopping/_search
{
"query": {
"match_all" : {}
},
"size": 7,
"from": 28
}

相关参数说明:
size:
指定每⻚显示多少条数据,默认值为10.
from:
指定跳过数据偏移量的⼤⼩,默认值为0,即默认看第⼀⻚。
查询指定⻚码的from值 = "(⻚码 - 1) * 每⻚数据⼤⼩(size)"

温馨提示:
⽣产环境中,不建议深度分⻚,百度的⻚码数量控制在76⻚左右。

6.查看“_source”对象的指定字段

1
2
3
4
5
6
7
8
9
10
11
12
13
POST http://10.0.0.103:9200/oldboyedu-shopping/_search
{
"query": {
"match_all" : {}
},
"size": 7,
"from": 28,
"_source": ["brand","price"]
}

相关参数说明:
_source:
⽤于指定查看"_source"对象的指定字段。

7.查询包含指定字段的文档 - exists

1
2
3
4
5
6
7
8
9
10
11
12
POST http://10.0.0.103:9200/oldboyedu-shopping/_search
{
"query": {
"exists" : {
"field": "hobby"
}
}
}

相关参数说明:
exists
判断某个字段是否存在,若存在则返回该⽂档,若不存在,则不返回⽂档。

8.语法高亮 - hightlight

1
2
3
4
5
6
7
8
9
10
11
12
13
14
15
16
17
18
19
20
21
22
23
24
25
POST http://10.0.0.103:9200/oldboyedu-shopping/_search
{
"query": {
"match": {
"brand": "苹果"
}
},
"highlight": {
"pre_tags": [
"<h1>"
],
"post_tags": [
"</h1>"
],
"fields": {
"brand": {}
}
}
}

相关参数说明:
highlight: 设置⾼亮。
fields: 指定对哪个字段进⾏语法⾼亮。
pre_tags: ⾃定义⾼亮的前缀标签。
post_tags ⾃定义⾼亮的后缀标签。

9.基于字段进行排序 - sort

1
2
3
4
5
6
7
8
9
10
11
12
13
14
15
16
17
POST http://10.0.0.103:9200/oldboyedu-shopping/_search
{
"query": {
"match_phrase": {
"brand": "苹果"
}
},
"sort": {
"price" :{
"order": "asc"
}
}
}

相关字段说明:
sort: 基于指定的字段进⾏排序。此处为指定的是"price"
order: 指定排序的规则,分为"asc"(升序)和"desc"(降序)。

10.多条件查询 - bool

1
2
3
4
5
6
7
8
9
10
11
12
13
14
15
16
17
18
19
20
21
22
23
24
25
26
27
28
29
30
31
32
33
34
35
36
37
38
39
40
41
42
43
44
45
46
47
48
49
50
51
52
53
54
55
56
57
58
59
60
61
62
63
64
65
66
67
68
69
70
71
POST http://10.0.0.103:9200/oldboyedu-shopping/_search
{
"query":{
"bool" :{
"must": [
{
"match_phrase": {
"brand" :" 苹果"
}
},
{
"match": {
"price": 5499
}
}
]
}
}
}

POST http://10.0.0.103:9200/oldboyedu-shopping/_search
{
"query":{
"bool" :{
"must_not": [
{
"match_phrase": {
"brand" :" 苹果"
}
},
{
"match": {
"price": 3399
}
}
]
}
}
}

POST http://10.0.0.103:9200/oldboyedu-shopping/_search
{
"query": {
"bool": {
"should": [
{
"match_phrase": {
"brand": " 苹果"
}
},
{
"match": {
"price": 5499
}
},
{
"match_phrase": {
"brand": " ⼩⽶"
}
}
],
"minimum_should_match": 2
}
}
}

温馨提示:
bool: 可以匹配多个条件查询。其中有"must","must_not","should"。
"must" 必须匹配的条件。
"must_not" 必须不匹配的条件,即和must相反。
"should" 不是必要条件,满⾜其中之⼀即可,可以使⽤"minimum_should_match"来限制满⾜要求的条件数量。

11.范围查询 - filter

1
2
3
4
5
6
7
8
9
10
11
12
13
14
15
16
17
18
19
20
21
22
23
24
25
26
27
28
29
30
31
POST http://10.0.0.103:9200/oldboyedu-shopping/_search
{
"query": {
"bool": {
"must": [
{
"match_phrase": {
"brand": " 苹果"
}
}
],
"filter": {
"range": {
"price": {
"gt": 5000,
"lt": 8000
}
}
}
}
}
}

相关字段说明:
filter 过滤数据。
range: 基于范围进⾏过滤,此处为基于的是"price"进⾏过滤。
常⻅的操作符如下:
gt: ⼤于。
lt: ⼩于。
gte: ⼤于等于。
lte: ⼩于等于。

12.精确匹配多个值 - terms

1
2
3
4
5
6
7
8
9
10
11
12
POST http://10.0.0.103:9200/oldboyedu-shopping/_search
{
"query": {
"terms": {
"price": [
4699,
299,
4066
]
}
}
}

13.多词搜索 - 了解即可

1
2
3
4
5
6
7
8
9
10
11
12
13
14
15
16
17
18
19
20
21
22
23
24
25
26
27
28
29
30
31
POST http://10.0.0.103:9200/oldboyedu-shopping/_search
{
"query": {
"bool": {
"must": [
{
"match": {
"title": {
"query": "显示器曲⾯",
"operator": "and"
}
}
}
]
}
},
"highlight": {
"pre_tags": [
"<h1>"
],
"post_tags": [
"</h1>"
],
"fields": {
"title": {}
}
}
}

温馨提示:
当我们将"operator"设置为"and"则⽂档必须包含"query"中的所有词汇,"operator"的默认值为"or"

14.权重案例 - 了解即可

1
2
3
4
5
6
7
8
9
10
11
12
13
14
15
16
17
18
19
20
21
22
23
24
25
26
27
28
29
30
31
32
33
34
35
36
37
38
39
40
41
42
43
44
POST http://10.0.0.103:9200/oldboyedu-shopping/_search
{
"query": {
"bool": {
"must": [
{
"match": {
"brand": {
"query": "⼩苹华"
}
}
}
],
"should": [
{
"match_phrase": {
"title": {
"query": "防⽔",
"boost": 2
}
}
},
{
"match_phrase": {
"title": {
"query": "⿊⾊",
"boost": 10
}
}
}
]
}
},
"highlight": {
"fields": {
"title": {},
"brand": {}
}
},
"_source": ""
}

温馨提示:
修改"boost"字段的值来提升相应权重。

15.聚合查询 - 了解即可

1
2
3
4
5
6
7
8
9
10
11
12
13
14
15
16
17
18
19
20
21
22
23
24
25
26
27
28
29
30
31
32
33
34
35
36
37
38
39
40
41
42
43
44
45
46
47
48
49
50
51
52
53
54
55
56
57
58
59
60
61
62
63
64
65
66
67
68
69
70
71
72
73
74
75
76
77
78
POST http://10.0.0.103:9200/oldboyedu-shopping/_search # 统计每个品牌的数量。
{
"aggs": {
"oldboyedu_brand_group": {
"terms":{
"field": "brand.keyword"
}
}
},
"size": 0
}
POST http://10.0.0.103:9200/oldboyedu-shopping/_search # 统计苹果商品中最贵的。
{
"query": {
"match_phrase": {
"brand": "苹果"
}
},
"aggs": {
"oldboyedu_max_shopping": {
"max": {
"field": "price"
}
}
},
"size": 0
}

POST http://10.0.0.103:9200/oldboyedu-shopping/_search # 统计华为商品中最便宜的。
{
"query": {
"match_phrase": {
"brand": "华为"
}
},
"aggs": {
"oldboyedu_min_shopping": {
"min": {
"field": "price"
}
}
},
"size": 0
}

POST http://10.0.0.103:9200/oldboyedu-shopping/_search # 统计⼩⽶商品的品均架构。
{
"query": {
"match_phrase": {
"brand": "⼩⽶"
}
},
"aggs": {
"oldboyedu_avg_shopping": {
"avg": {
"field": "price"
}
}
},
"size": 0
}

POST http://10.0.0.103:9200/oldboyedu-shopping/_search # 统计⻢下⼩⽶所有商品的价格。
{
"query": {
"match_phrase": {
"brand": "⼩⽶"
}
},
"aggs": {
"oldboyedu_sum_shopping": {
"sum": {
"field": "price"
}
}
},
"size": 0
}

ES 集群迁移

1.部署 ES6 分布式集群

1
2
3
4
5
6
7
8
9
10
11
12
13
14
15
16
17
18
19
20
21
22
23
24
25
26
27
28
29
30
31
32
33
34
35
36
37
38
39
40
41
42
43
44
45
46
47
48
49
50
51
52
# (1)下载ES 6的软件包
wget https://artifacts.elastic.co/downloads/elasticsearch/elasticsearch-6.8.23.tar.gz

# (2)解压软件包并创建数据⽬录和⽇志⽬录
tar xf elasticsearch-6.8.23.tar.gz -C /oldboyedu/softwares/
install -d /oldboyedu/{data,logs}/es6 -o oldboyedu -g oldboyedu
chown oldboyedu:oldboyedu -R /oldboyedu/softwares/elasticsearch-6.8.23/

# (3)修改配置⽂件
vim /oldboyedu/softwares/elasticsearch-6.8.23/config/elasticsearch.yml
.....
cluster.name: oldboyedu-linux80-es6
node.name: elk101
path.data: /oldboyedu/data/es6
path.logs: /oldboyedu/logs/es6
network.host: 0.0.0.0
http.port: 19200
transport.tcp.port: 19300
discovery.zen.ping.unicast.hosts: ["10.0.0.101","10.0.0.102","10.0.0.103"]
discovery.zen.minimum_master_nodes: 2

# (4)同步环境到其他节点
data_rsync.sh /oldboyedu/softwares/elasticsearch-6.8.23

# (5)其他节点修改⼀下⼏个参数即可修改各节点的"node.name"名称即可。

# (6)编写启动脚本
cat > /etc/sysconfig/jdk <<EOF
JAVA_HOME=/oldboyedu/softwares/jdk
EOF
cat > /usr/lib/systemd/system/es68.service <<EOF
[Unit]
Description=Oldboyedu linux80 ELK
After=network.target

[Service]
Type=forking
EnvironmentFile=/etc/sysconfig/jdk
ExecStart=/oldboyedu/softwares/elasticsearch-6.8.23/bin/elasticsearch -d
Restart=no
User=oldboyedu
Group=oldboyedu
LimitNOFILE=131070

[Install]
WantedBy=multi-user.target
EOF

systemctl daemon-reload

# (7)启动服务
systemctl start es68

2.基于_reindex 的 API 迁移

1
2
3
4
5
6
7
8
9
10
11
12
13
14
15
16
17
18
19
20
21
22
23
24
25
26
27
28
29
30
31
32
33
34
35
POST http://10.0.0.103:9200/_reindex
{
"source": {
"index": "oldboyedu-shopping"
},
"dest": {
"index": "oldboyedu-shopping-new"
}
}

# 不同⼀个集群迁移索引
POST http://10.0.0.103:9200/_reindex
{
"source": {
"index": "oldboyedu-shopping",
"remote": {
"host": "http://10.0.0.101:19200"
},
"query": {
"match_phrase": {
"brand": "Dell"
}
}
},
"dest": {
"index": "oldboyedu-shopping-new-22222222222"
}
}

温馨提示:
(1)不同集群迁移时,需要修改9200端⼝对应的ES7的elasticsearch.yml配置⽂件,添加如下内容,并重启集群。
reindex.remote.whitelist: "*:*"
(2)跨集群迁移时,可以使⽤DSL语句来对源集群的数据进⾏过滤,⽐如上⾯的"query"语句。
推荐阅读:
https://www.elastic.co/guide/en/elasticsearch/reference/7.17/docs-reindex.html

3.基于 logstash 实现索引跨集群迁移

1
2
3
4
5
6
7
8
9
10
11
12
13
14
15
16
17
18
19
20
21
22
[root@elk101.oldboyedu.com ~]$ cat conf-logstash/03-es-to-es.conf
input {
elasticsearch {
index => "oldboyedu-shopping"
hosts => "10.0.0.101:19200"
query => '{ "query": { "match_phrase": { "brand": "dell" } }}'
}
}
output {
stdout { }
elasticsearch {
index => "oldboyedu-shopping-6666666666666666666"
hosts => "10.0.0.101:9200"
}
}
[root@elk101.oldboyedu.com ~]$
[root@elk101.oldboyedu.com ~]$ logstash -rf conf-logstash/03-es-to-es.conf

温馨提示:
对于低版本的数据迁移到⾼版本时,⽐如从ES5迁移到ES7,应该注意不同点:
(1)默认的分⽚数量和副本数量;
(2)默认的⽂档类型是否相同,尤其是在ES7版本中移除了type类型,仅保留了"_doc"这⼀种内置类型;

ES 集群常用的 API

1.ES 集群健康状态 API(heath)

1
2
3
4
5
6
7
8
9
10
11
12
13
14
15
16
17
18
19
20
21
22
23
24
25
26
27
28
29
30
31
32
33
34
35
36
37
38
39
40
41
42
43
44
45
46
# (1)安装jq⼯具
yum -y install epel-release
yum -y install jq

# (2)测试取数据
curl http://10.0.0.103:9200/_cluster/health 2>/dev/null| jq
curl http://10.0.0.103:9200/_cluster/health 2>/dev/null| jq .status
curl http://10.0.0.103:9200/_cluster/health 2>/dev/null| jq
.active_shards_percent_as_number


相关参数说明:
cluster_name
集群的名称。
status
集群的健康状态,基于其主分⽚和副本分⽚的状态。
ES集群有以下三种状态:
green 所有分⽚都已分配。
yellow 所有主分⽚都已分配,但⼀个或多个副本分⽚未分配。如果集群中的某个节点发⽣故障,则在修复该节点之前,某些数据可能不可⽤。
red ⼀个或多个主分⽚未分配,因此某些数据不可⽤。这可能会在集群启动期间短暂发⽣,因为分配了主分⽚。
timed_out
是否在参数false指定的时间段内返回响应(默认情况下30秒)。
number_of_nodes
集群内的节点数。
number_of_data_nodes
作为专⽤数据节点的节点数。
active_primary_shards
可⽤主分⽚的数量。
active_shards
可⽤主分⽚和副本分⽚的总数。
relocating_shards
正在重定位的分⽚数。
initializing_shards
正在初始化的分⽚数。
unassigned_shards
未分配的分⽚数。
delayed_unassigned_shards
分配因超时设置⽽延迟的分⽚数。
number_of_pending_tasks
尚未执⾏的集群级别更改的数量。
number_of_in_flight_fetch
未完成的提取次数。
task_max_waiting_in_queue_millis
⾃最早启动的任务等待执⾏以来的时间(以毫秒为单位)。
active_shards_percent_as_number
集群中活动分⽚的⽐率,以百分⽐表示。

2.ES 集群的设置及优先级(settings)

1
2
3
4
5
6
7
8
9
10
11
12
13
14
15
16
17
18
19
20
21
22
23
24
25
26
27
如果您使⽤多种⽅法配置相同的设置,Elasticsearch 会按以下优先顺序应⽤这些设置:
(1)Transient setting(临时配置,集群重启后失效)
(2)Persistent setting(持久化配置,集群重启后依旧⽣效)
(3)elasticsearch.yml setting(配置⽂件)
(4)Default setting value(默认设置值)

# (1)查询集群的所有配置信息
GET http://10.0.0.103:9200/_cluster/settings?include_defaults=true&flat_settings=true

# (2)修改集群的配置信息
PUT http://10.0.0.103:9200/_cluster/settings
{
"transient": {
"cluster.routing.allocation.enable": "none"
}
}

相关参数说明:
"cluster.routing.allocation.enable":
"all" 允许所有分⽚类型进⾏分配。
"primaries" 仅允许分配主分⽚。
"new_primaries" 仅允许新创建索引分配主分⽚。
"none" 不允许分配任何类型的分配。

参考链接:
https://www.elastic.co/guide/en/elasticsearch/reference/7.17/cluster-get-settings.html
https://www.elastic.co/guide/en/elasticsearch/reference/7.17/cluster-update-settings.html

3.集群状态 API(state)

1
2
3
4
5
6
7
8
9
10
11
12
13
14
15
16
17
18
集群状态是⼀种内部数据结构,它跟踪每个节点所需的各种信息,包括:
(1)集群中其他节点的身份和属性
(2)集群范围的设置
(3)索引元数据,包括每个索引的映射和设置
(4)集群中每个分⽚副本的位置和状态

# (1)查看集群的状态信息
GET http://10.0.0.103:9200/_cluster/state

# (2)只查看节点信息。
GET http://10.0.0.103:9200/_cluster/state/nodes

# (3)查看nodes,version,routing_table这些信息,并且查看以"oldboyedu*"开头的所有索引
http://10.0.0.103:9200/_cluster/state/nodes,version,routing_table/oldboyedu*


推荐阅读:
https://www.elastic.co/guide/en/elasticsearch/reference/7.17/cluster-state.html

4.集群统计 API(stats)

1
2
3
4
5
6
7
8
Cluster Stats API 允许从集群范围的⻆度检索统计信息。返回基本索引指标(分⽚数量、存储⼤⼩、内存使⽤情况)和有关构成集群的当前节点的信息(数量、⻆⾊、操作系统、jvm 版本、内存使⽤情况、cpu 和已安装的插件)。

# (1)查看统计信息
GET http://10.0.0.103:9200/_cluster/stats


推荐阅读:
https://www.elastic.co/guide/en/elasticsearch/reference/7.17/cluster-stats.html

5.查看集群的分片分配情况(allocation)

集群分配解释 API 的⽬的是为集群中的分⽚分配提供解释。

对于未分配的分⽚,解释 API 提供了有关未分配分⽚的原因的解释。

对于分配的分⽚,解释 API 解释了为什么分⽚保留在其当前节点上并且没有移动或重新平衡到另⼀个节点。

当您尝试诊断分⽚未分配的原因或分⽚继续保留在其当前节点上的原因时,此 API 可能⾮常有⽤,⽽您可能会对此有所期待。

1
2
3
4
5
6
7
8
9
10
# (1)分析teacher索引的0号分⽚未分配的原因。
GET http://10.0.0.101:9200/_cluster/allocation/explain
{
"index": "teacher",
"shard": 0,
"primary": true
}

推荐阅读:
https://www.elastic.co/guide/en/elasticsearch/reference/7.17/cluster-allocation-explain.html

6.集群分片重路由 API(reroute)

reroute 命令允许⼿动更改集群中各个分⽚的分配。

例如,可以将分⽚从⼀个节点显式移动到另⼀个节点,可以取消分配,并且可以将未分配的分⽚显式分配给特定节点。

1
2
3
4
5
6
7
8
9
10
11
12
13
14
15
16
17
18
19
20
21
22
23
24
25
26
POST http://10.0.0.101:9200/_cluster/reroute # 将"teacher"索引的0号分⽚从elk102节点移动到elk101节点。
{
"commands": [
{
"move": {
"index": "teacher",
"shard": 0,
"from_node": "elk102.oldboyedu.com",
"to_node": "elk101.oldboyedu.com"
}
}
]
}

POST http://10.0.0.101:9200/_cluster/reroute # 取消副本分⽚的分配,其副本会重新初始化分配。
{
"commands": [
{
"cancel": {
"index": "teacher",
"shard": 0,
"node": "elk101.oldboyedu.com"
}
}
]
}

推荐阅读: https://www.elastic.co/guide/en/elasticsearch/reference/7.17/cluster-reroute.html

7.今日作业

1
2
3
4
5
6
(1)完成课堂的所有练习;

进阶作业:
(2)使⽤zabbix健康ES集群的健康状态,包含以下2个指标:
curl http://10.0.0.103:9200/_cluster/health 2>/dev/null| jq .status
curl http://10.0.0.103:9200/_cluster/health 2>/dev/null| jq .active_shards_percent_as_number

ES 集群理论篇

1.倒排索引

⾯试题: 分⽚底层时如何⼯作的?

答: 分⽚底层对应的是⼀个 Lucene 库,⽽ Lucene 底层使⽤倒排索引技术实现。

正排索引(正向索引)

我们 MySQL 为例,⽤ id 字段存储博客⽂章的编号,⽤ context 存储⽂件的内容。

1
2
CREATE TABLE blog (id INT PRIMARY KEY AUTO_INCREMENT, contextTEXT);
INDEX blog VALUES (1,'I am Jason Yin, I love Linux ...')

此时,如果我们查询⽂章内容包含”Jason Yin”的词汇的时候,就⽐较麻烦了,因为要进⾏全表扫描。

1
SELECT * FROM blog WHERE context LIKE 'Jason Yin';

倒排索引(反向索引)

ES 使⽤⼀种称为”倒排索引”的结构,它适⽤于快速的全⽂检索。
倒排索引中有以下三个专业术语:

1、词条:
指的是最⼩的存储和查询单元,换句话说,指的是您想要查询的关键字(词)。
对应英⽂⽽⾔通常指的是⼀个单词,⽽对于中⽂⽽⾔,对应的是⼀个词组。

2、词典(字典):
它是词条的集合,底层通常基于”Btree+”和”HASHMap”实现。

3、倒排表:
记录了词条出现在什么位置,出现的频率是什么。
倒排表中的每⼀条记录我们称为倒排项。

倒排索引的搜索过程:

  1. ⾸先根据⽤户需要查询的词条进⾏分词后,将分词后的各个词条字典进⾏匹配,验证词条在词典中是否存在;
  2. 如果上⼀步搜索结果发现词条不在字典中,则结束本次搜索,如果在词典中,就需要去查看倒排表中的记录(倒排项);
  3. 根据倒排表中记录的倒排项来定位数据在哪个⽂档中存在,⽽后根据这些⽂档的”_id”来获取指定的数据;

综上所述,假设有 10 亿篇⽂章,对于 mysql 不创建索引的情况下,会进⾏全表扫描搜索”JasonYin”。⽽对于 ES ⽽⾔,其只需要将倒排表中返回的 id 进⾏扫描即可,⽽⽆须进⾏全量查询。

2.集群角色

1
2
3
4
5
6
7
8
9
10
11
12
13
14
15
16
17
18
19
20
21
⻆⾊说明:
c: Cold data
d: data node
f: frozen node
h: hot node
i: ingest node
l: machine learning node
m: master eligible node
r: remote cluster client node
s: content node
t: transform node
v: voting-only node
w: warm node
-: coordinating node only

常⽤的⻆⾊说明:
data node: 指的是存储数据的节点。
node.data: true
master node: 控制ES集群,并维护集群的状态(cluster state,包括节点信息,索引信息等,ES集群每个节点都有⼀份)。
node.master: true
coordinating: 协调节点可以处理请求的节点,ES集群所有的节点均为协调节点,该⻆⾊⽆法取消。

3.文档的写流程

4.单个文档的读流程

5.ES 底层存储原理剖析

事务⽇志存储在哪⾥?

1
2
3
在索引分⽚⽬录下,取名⽅式如下:
translog-N.tlog: 真正的⽇志⽂件,N表示generation(代)的意思,通过它跟索引⽂件关联
tranlog.ckp: ⽇志的元数据⽂件,⻓度总是20个字节,记录3个信息:偏移量 & 事务操作数量 & 当前代

什么时候删事务⽇志?

1
在flush的时候,translog⽂件会被清空。实际的过程是先删掉⽼⽂件,再创建⼀个新⽂件,取名时,序号加1,⽐如图2中,flush后你只会看到 translog-2.tlog,原来的translog-1.tlog已被删除。

为什么要删?

1
因为数据修改已经写⼊磁盘了,之前的旧的⽇志就⽆⽤武之地了,留着只能⽩嫖存储空间。

6.乐观锁机制 - 了解即可

两种⽅法通常被⽤来解决并发更新时变更不会丢失的解决⽅案:

1、悲观并发控制

这种⽅法被关系型数据库⼴泛使⽤,它假定有变更冲突可能发⽣,因此阻塞访问资源以防⽌冲突。⼀个典型的例⼦是修改⼀⾏数据之前像将其锁住,确保只有获得锁的线程能够对这⾏数据进⾏修改。

2、乐观锁并发控制

ES 中使⽤的这种⽅法假设冲突是不可能发⽣的,并且不会阻塞正在尝试的操作。然⽽,如果源数据在读写当中被修改,更新将会失败。应⽤程序接下来该如果解决冲突。例如,可以重试更新,使⽤新的数据,或者将相关情况报告给⽤户。

1
2
3
4
5
6
7
8
9
10
11
12
13
14
15
16
17
18
19
20
21
22
23
24
25
26
27
28
29
30
31
32
33
34
35
36
37
38
39
40
# (1)创建⽂档
PUT http://10.0.0.103:9200/oldboyedu_student/_doc/10001
{
"name": "王岩",
"age":25,
"hobby":["苍⽼师","⽼男孩","欧美"]
}

# (2)模拟事物1修改
POST http://10.0.0.103:9200/oldboyedu_student/_doc/10001/_update?
if_seq_no=0&if_primary_term=1
{
"doc": {
"hobby": [
"⽇韩",
"国内"
]
}
}

# (3)模拟事物2修改(如果上⾯的事物执⾏成功,则本事物执⾏失败,因为"_seq_no"发⽣变化)
POST http://10.0.0.103:9200/oldboyedu_student/_doc/10001/_update?
if_seq_no=0&if_primary_term=1
{
"doc": {
"hobby": [
"欧美"
]
}
}

# 扩展:(基于扩展的version版本来控制)
POST http://10.0.0.103:9200/oldboyedu_student/_doc/10001?version=10&version_type=external
{
"name": "oldboy",
"hobby": [
"⽇韩",
"国内"
]
}

python 操作 ES 集群 API 实战

1.创建索引

1
2
3
4
5
6
7
8
9
10
11
12
13
14
15
16
17
18
19
20
21
22
23
24
25
26
27
28
29
30
31
32
33
34
35
36
37
38
39
40
41
#!/usr/bin/env python3
# _*_coding:utf-8_*_
from elasticsearch import Elasticsearch

es = Elasticsearch(['10.0.0.101:9200', '10.0.0.102:9200',
'10.0.0.103:9200'])
msg_body = {
"settings": {
"index": {
"number_of_replicas": "0",
"number_of_shards": "5"
}
},
"mappings": {
"properties": {
"ip_addr": {
"type": "ip"
},
"name": {
"type": "text"
},
"id": {
"type": "long"
},
"hobby": {
"type": "text"
},
"email": {
"type": "keyword"
}
}
},
"aliases": {
"oldboyedu-elstaicstack-linux80-python": {},
"oldboyedu-linux80-python": {}
}
}
result = es.indices.create(index="oldboyedu-linux80-2022", body=msg_body)
print(result)

es.close()

2.写⼊单个⽂档

1
2
3
4
5
6
7
8
9
10
11
12
13
14
15
16
17
18
19
20
21
22
23
#!/usr/bin/env python3
# _*_coding:utf-8_*_
import sys
from elasticsearch import Elasticsearch

# 设置字符集,兼容Python2
reload(sys)
sys.setdefaultencoding('utf-8')
es = Elasticsearch(['10.0.0.101:9200', '10.0.0.102:9200',
'10.0.0.103:9200'])
# 写⼊单个⽂档
msg_body = {
"name": "Jason Yin",
"ip_addr": "120.53.104.136",
"blog": "https://blog.yinzhengjie.com/",
"hobby": ["k8s", "docker", "elk"],
"email": "yinzhengjie@oldboyedu.com",
"id": 10086,
}
result = es.index(index="oldboyedu-linux80-2022", doc_type="_doc", body=msg_body)
print(result)

es.close()

3.写入多个文档

1
2
3
4
5
6
7
8
9
10
11
12
13
14
15
16
17
18
19
20
21
22
23
24
25
26
27
28
29
30
31
32
33
34
35
36
37
38
39
40
41
#!/usr/bin/env python3
# _*_coding:utf-8_*_
import sys
from elasticsearch import Elasticsearch
from elasticsearch.helpers import bulk

# 设置字符集,兼容Python2
reload(sys)
sys.setdefaultencoding('utf-8')
es = Elasticsearch(['10.0.0.101:9200', '10.0.0.102:9200',
'10.0.0.103:9200'])
# 批量写⼊多个⽂档
doc2 = {
"id": 10010,
"name": "⽼男孩",
"age": 45,
"hobby": ["下棋", "抖⾳", "思想课"],
"ip_addr": "10.0.0.101",
"email": "oldboy@oldboyedu.com"
}
doc3 = {
"id": 10011,
"name": "李导",
"age": 32,
"hobby": ["三剑客", "打枪"],
"email": "lidao@oldboyedu.com",
"ip_addr": "10.0.0.201"
}
doc4 = {
"id": 100012,
"name": "赵嘉欣",
"age": 24,
"hobby": ["⽇韩", "⼩说", "王岩"],
"email": "zhaojiaxin@oldboyedu.com",
"ip_addr": "10.0.0.222"
}
many_doc = [doc2, doc3, doc4]
write_number, _ = bulk(es, many_doc, index="oldboyedu-linux80-2022")
print(write_number)

es.close()

4.全量查询

1
2
3
4
5
6
7
8
9
10
11
12
13
14
15
16
17
#!/usr/bin/env python3
# _*_coding:utf-8_*_
from elasticsearch import Elasticsearch

es = Elasticsearch(['10.0.0.101:9200', '10.0.0.102:9200',
'10.0.0.103:9200'])
# 全量查询
result = es.search(index="oldboyedu-linux80-2022")
print(result)
print(result["hits"])
print(result["hits"]["hits"])
print(result["hits"]["hits"][0]["_source"])
print(result["hits"]["hits"][0]["_source"]["name"])
print(result["hits"]["hits"][0]["_source"]["hobby"])

es.close()

5.查看多个文档

1
2
3
4
5
6
7
8
9
10
11
12
13
14
15
16
17
#!/usr/bin/env python3
# _*_coding:utf-8_*_
import sys
from elasticsearch import Elasticsearch

# 设置字符集,兼容Python2
reload(sys)
sys.setdefaultencoding('utf-8')
es = Elasticsearch(['10.0.0.101:9200', '10.0.0.102:9200',
'10.0.0.103:9200'])
# 获取多个⽂档
doc1 = {'ids': ["5gIk24AB2f3QZVpX1AxN", "5AIk24AB2f3QZVpX1AxN"]}
res = es.mget(index="oldboyedu-linux80-2022", body=doc1)
print(res)
print(res['docs'])

es.close()

6.DSL 查询

1
2
3
4
5
6
7
8
9
10
11
12
13
14
15
16
17
18
19
20
21
22
23
24
25
26
27
28
29
30
31
32
33
34
35
36
37
38
39
40
41
42
43
44
45
46
47
48
49
50
51
52
53
54
55
56
57
58
59
60
61
62
63
#!/usr/bin/env python3
# _*_coding:utf-8_*_
import sys
from elasticsearch import Elasticsearch

# 设置字符集,兼容Python2
reload(sys)
sys.setdefaultencoding('utf-8')
es = Elasticsearch(['10.0.0.101:9200', '10.0.0.102:9200',
'10.0.0.103:9200'])
# DSL语句查询
dsl = {
"query": {
"match": {
"hobby": "王岩"
}
}
}
# DSL语句查询
# dsl = {
# "query": {
# "bool": {
# "should": [
# {
# "match": {
# "type": "pets"
# }
# },
# {
# "match": {
# "type": "lunxury"
# }
# }
# ],
# "minimum_should_match": 1,
# "filter": {
# "range": {
# "price": {
# "gt": 1500,
# "lt": 2500
# }
# }
# }
# }
# },
# "sort": {
# "price": {
# "order": "desc"
# }
# },
# "_source": [
# "title",
# "price",
# "producer"
# ]
# }

res = es.search(index="shopping", body=dsl)
print(res)
res = es.search(index="oldboyedu-linux80-2022", body=dsl)
print(res)

es.close()

7.查看索引是否存在

1
2
3
4
5
6
7
8
9
10
#!/usr/bin/env python3
# _*_coding:utf-8_*_
from elasticsearch import Elasticsearch

es = Elasticsearch(['10.0.0.101:9200', '10.0.0.102:9200',
'10.0.0.103:9200'])
# 判断索引是否存在
print(es.indices.exists(index="oldboyedu-shopping"))

es.close()

8.修改文档

1
2
3
4
5
6
7
8
9
10
11
12
#!/usr/bin/env python3
# _*_coding:utf-8_*_
from elasticsearch import Elasticsearch

es = Elasticsearch(['10.0.0.101:9200', '10.0.0.102:9200', '10.0.0.103:9200'])
new_doc = {
'doc': {"hobby": ['下棋', '抖⾳', '思想课', "Linux运维"], 'address': '中华⼈⺠共和国北京市昌平区沙河镇⽼男孩教育'}}
# 更新⽂档
res = es.update(index="oldboyedu-linux80-2022", id='5gIk24AB2f3QZVpX1AxN', body=new_doc)
print(res)

es.close()

9.删除单个文档

1
2
3
4
5
6
7
8
9
10
#!/usr/bin/env python3
# _*_coding:utf-8_*_
from elasticsearch import Elasticsearch

es = Elasticsearch(['10.0.0.101:9200', '10.0.0.102:9200', '10.0.0.103:9200'])
# 删除单个⽂档
result = es.delete(index="oldboyedu-linux80-2022", id="5gIk24AB2f3QZVpX1AxN")
print(result)

es.close()

10.删除索引

1
2
3
4
5
6
7
8
9
10
#!/usr/bin/env python3
# _*_coding:utf-8_*_
from elasticsearch import Elasticsearch

es = Elasticsearch(['10.0.0.101:9200', '10.0.0.102:9200', '10.0.0.103:9200'])
# 删除索引
result = es.indices.delete(index="oldboyedu-linux80-2022")
print(result)

es.close()

ES 集群加密的 Kibana 的 RABC 实战

1.基于 nginx 反向代理控制 kibana

1
2
3
4
5
6
7
8
9
10
11
12
13
14
15
16
17
18
19
20
21
22
23
24
# (1)部署nginx服务 略,参考之前的笔记即可。

# (2)编写nginx的配置⽂件
cat > /etc/nginx/conf.d/kibana.conf <<EOF
server {
listen 80;
server_name kibana.oldboyedu.com;
location / {
proxy_pass http://10.0.0.103:5601$request_uri;
auth_basic "oldboyedu kibana web!";
auth_basic_user_file conf/htpasswd;
}
}
EOF

# (3)创建账号⽂件
mkdir -pv /etc/nginx/conf
htpasswd -c -b /etc/nginx/conf/htpasswd admin oldboyedu

# (4)启动nginx服务
nginx -t
systemcat restart nginx

# (5)访问nginx验证kibana访问 如下图所示。

2.配置 ES 集群 TLS 认证

1
2
3
4
5
6
7
8
9
10
11
12
13
14
15
16
17
18
19
20
21
22
23
24
25
26
27
28
29
30
# (1)⽣成证书⽂件
cd /oldboyedu/softwares/es/
elasticsearch-certutil cert -out config/elastic-certificates.p12 -pass ""

# (2)为证书⽂件修改属主和属组
chown oldboyedu:oldboyedu config/elastic-certificates.p12

# (3)同步证书⽂件到其他节点
data_rsync.sh `pwd`/config/elastic-certificates.p12

# (4)修改ES集群的配置⽂件
vim/oldboyedu/softwares/es/config/elasticsearch.yml
...
# 在最后⼀⾏添加以下内容
xpack.security.enabled: true
xpack.security.transport.ssl.enabled: true
xpack.security.transport.ssl.verification_mode: certificate
xpack.security.transport.ssl.keystore.path: elastic-certificates.p12
xpack.security.transport.ssl.truststore.path: elastic-certificates.p12

# (5)同步ES配置⽂件到其他节点
data_rsync.sh `pwd`/config/elasticsearch.yml

# (6)所有节点重启ES集群
systemctl restart es

# (7)⽣成随机密码(如上图所示)
elasticsearch-setup-passwords auto

# (8)postman访问 如下图所示。

3.kibana 添加 ES 认证

1
2
3
4
5
6
7
8
9
10
11
# (1)修改kibana的配置⽂件
vim /oldboyedu/softwares/kibana/config/kibana.yml
...

elasticsearch.username: "kibana_system"
elasticsearch.password: "NqJFTqDoVLmgX70bMc9t"

# (2)重启kibana访问
su -c "kibana" oldboyedu

# (3)访问测试 如下图所示。

4.kibana 的 RBAC

具体实操⻅视频。

5.logstash 写入 ES 加密集群案例

1
2
3
4
5
6
7
8
9
10
11
12
input {
stdin {}
}
output {
stdout { }
elasticsearch {
index => "oldboyedu-linux80-logstash-6666666666666666666"
hosts => "10.0.0.101:9200"
user => "logstash-linux80"
password => "123456"
}
}

温馨提示:
建议⼤家不要使⽤ elastic 管理员⽤户给 logstash 程序使⽤,⽽是创建⼀个普通⽤户,并为该⽤户细化权限。

6.filebeat 写入 ES 加密集群案例

1
2
3
4
5
6
7
8
9
10
11
12
13
14
15
16
17
filebeat.inputs:
- type: stdin

output.elasticsearch:
enabled: true
hosts: ["http://10.0.0.101:9200", "http://10.0.0.102:9200", "http://10.0.0.103:9200"]
index: "oldboyedu-linux80-stdin-%{+yyyy.MM.dd}"
username: "filebeat-linux80"
password: "123456"

setup.ilm.enabled: false
setup.template.name: "oldboyedu-linux"
setup.template.pattern: "oldboyedu-linux*"
setup.template.overwrite: true
setup.template.settings:
index.number_of_shards: 3
index.number_of_replicas: 0

温馨提示:
建议⼤家不要使⽤ elastic 管理员⽤户给 filebeat 程序使⽤,⽽是创建⼀个普通⽤户,并为该⽤户细化权限。

SonarQube 是一个用于代码质量管理的开放平台,通过插件机制,SonarQube 可以集成不同的测试
工具,代码分析工具,以及持续集成工具,例如 Hudson/Jenkins 等

官网:https://www.sonarqube.org/

部署 SonarQube

略…

jenkins 服务器部署扫描器 sonar-scanner

官方文档: https://docs.sonarqube.org/latest/analysis/scan/sonarscanner/

部署 sonar-scanner

顾名思义,扫描器的具体工作就是扫描代码,sonarqube 通过调用扫描器 sonar-scanner 进行代码质量分析

下载地址: https://binaries.sonarsource.com/Distribution/sonar-scanner-cli/

1
2
3
4
5
[root@jenkins src]$unzip sonar-scanner-cli-4.6.0.2311.zip
[root@jenkins src]$mv sonar-scanner-4.6.0.2311/ /usr/local/sonar-scanner
[root@jenkins src]$vim /usr/local/sonar-scanner/conf/sonar-scanner.properties
sonar.host.url=http://10.0.1.102:9000 # 指向sonarqube服务器的地址
sonar.sourceEncoding=UTF-8 # Default source code encoding

准备测试代码

1
2
3
4
5
6
7
8
9
10
11
12
13
14
15
16
17
18
19
20
21
22
23
24
[root@jenkins src]$unzip sonar-examples-master.zip ^C
[root@jenkins src]$cd sonar-examples-master/projects/languages/php/php-sonar-runner
[root@jenkins php-sonar-runner]$ll
total 24
drwxr-xr-x 3 root root 4096 Mar 2 23:30 ./
drwxr-xr-x 4 root root 4096 Jul 25 2016 ../
-rw-r--r-- 1 root root 453 Jul 25 2016 README.md
-rw-r--r-- 1 root root 331 Jul 25 2016 sonar-project.properties
drwxr-xr-x 2 root root 4096 Jul 25 2016 src/
-rw-r--r-- 1 root root 272 Jul 25 2016 validation.txt
[root@jenkins php-sonar-runner]$cat sonar-project.properties # 确保有这个文件
# Required metadata
sonar.projectKey=org.sonarqube:php-simple-sq-scanner
sonar.projectName=PHP :: Simple Project :: SonarQube Scanner
sonar.projectVersion=1.0

# Comma-separated paths to directories with sources (required)
sonar.sources=src

# Language
sonar.language=php

# Encoding of the source files
sonar.sourceEncoding=UTF-8

在源代码目录执行扫描

在 sonar-project.properties 这个文件的目录下,执行 sonar-scanner 即可:

1
2
3
4
5
6
7
8
9
10
11
12
13
14
15
16
17
18
19
20
21
22
23
24
25
26
27
28
29
30
31
32
33
34
35
36
37
38
39
40
41
42
43
44
45
46
47
48
49
50
51
52
53
54
55
56
57
58
59
60
61
62
63
64
65
66
67
68
69
70
71
72
73
74
75
76
77
78
79
80
81
82
83
84
85
86
87
88
89
[root@jenkins php-sonar-runner]$ll
total 24
drwxr-xr-x 3 root root 4096 Mar 2 23:30 ./
drwxr-xr-x 4 root root 4096 Jul 25 2016 ../
-rw-r--r-- 1 root root 453 Jul 25 2016 README.md
-rw-r--r-- 1 root root 331 Jul 25 2016 sonar-project.properties
drwxr-xr-x 2 root root 4096 Jul 25 2016 src/ # 代码
-rw-r--r-- 1 root root 272 Jul 25 2016 validation.txt
[root@jenkins php-sonar-runner]$
[root@jenkins php-sonar-runner]$/usr/local/sonar-scanner/bin/sonar-scanner # 测试
INFO: Scanner configuration file: /usr/local/sonar-scanner/conf/sonar-scanner.properties
INFO: Project root configuration file: /usr/local/src/sonar-examples-master/projects/languages/php/php-sonar-runner/sonar-project.properties
INFO: SonarScanner 4.6.0.2311
INFO: Java 11.0.10 Oracle Corporation (64-bit)
INFO: Linux 4.15.0-136-generic amd64
INFO: User cache: /root/.sonar/cache
INFO: Scanner configuration file: /usr/local/sonar-scanner/conf/sonar-scanner.properties
INFO: Project root configuration file: /usr/local/src/sonar-examples-master/projects/languages/php/php-sonar-runner/sonar-project.properties
INFO: Analyzing on SonarQube server 7.9.5
INFO: Default locale: "en_US", source code encoding: "UTF-8"
INFO: Load global settings
INFO: Load global settings (done) | time=225ms
INFO: Server id: 3B6AA649-AXfye5RyEWrAjeeRmPxd
INFO: User cache: /root/.sonar/cache
INFO: Load/download plugins
INFO: Load plugins index
INFO: Load plugins index (done) | time=126ms
INFO: Plugin [l10nzh] defines 'l10nen' as base plugin. This metadata can be removed from manifest of l10n plugins since version 5.2.
INFO: Load/download plugins (done) | time=3633ms
INFO: Process project properties
INFO: Execute project builders
INFO: Execute project builders (done) | time=18ms
INFO: Project key: org.sonarqube:php-simple-sq-scanner
INFO: Base dir: /usr/local/src/sonar-examples-master/projects/languages/php/php-sonar-runner
INFO: Working dir: /usr/local/src/sonar-examples-master/projects/languages/php/php-sonar-runner/.scannerwork
INFO: Load project settings for component key: 'org.sonarqube:php-simple-sq-scanner'
INFO: Load quality profiles
INFO: Load quality profiles (done) | time=293ms
INFO: Load active rules
INFO: Load active rules (done) | time=3061ms
WARN: SCM provider autodetection failed. Please use "sonar.scm.provider" to define SCM of your project, or disable the SCM Sensor in the project settings.
INFO: Indexing files...
INFO: Project configuration:
INFO: Load project repositories
INFO: Load project repositories (done) | time=19ms
INFO: 1 file indexed
INFO: Quality profile for php: Sonar way
INFO: ------------- Run sensors on module PHP :: Simple Project :: SonarQube Scanner
INFO: Load metrics repository
INFO: Load metrics repository (done) | time=134ms
WARNING: An illegal reflective access operation has occurred
WARNING: Illegal reflective access by net.sf.cglib.core.ReflectUtils$1 (file:/root/.sonar/cache/866bb1adbf016ea515620f1aaa15ec53/sonar-javascript-plugin.jar) to method java.lang.ClassLoader.defineClass(java.lang.String,byte[],int,int,java.security.ProtectionDomain)
WARNING: Please consider reporting this to the maintainers of net.sf.cglib.core.ReflectUtils$1
WARNING: Use --illegal-access=warn to enable warnings of further illegal reflective access operations
WARNING: All illegal access operations will be denied in a future release
INFO: Sensor JaCoCo XML Report Importer [jacoco]
INFO: Sensor JaCoCo XML Report Importer [jacoco] (done) | time=12ms
INFO: Sensor JavaXmlSensor [java]
INFO: Sensor JavaXmlSensor [java] (done) | time=7ms
INFO: Sensor HTML [web]
INFO: Sensor HTML [web] (done) | time=144ms
INFO: Sensor PHP sensor [php]
INFO: 1 source files to be analyzed
INFO: 1/1 source files have been analyzed
INFO: No PHPUnit test report provided (see 'sonar.php.tests.reportPath' property)
INFO: No PHPUnit coverage reports provided (see 'sonar.php.coverage.reportPaths' property)
INFO: Sensor PHP sensor [php] (done) | time=1652ms
INFO: Sensor Analyzer for "php.ini" files [php]
INFO: Sensor Analyzer for "php.ini" files [php] (done) | time=26ms
INFO: ------------- Run sensors on project
INFO: Sensor Zero Coverage Sensor
INFO: Sensor Zero Coverage Sensor (done) | time=21ms
INFO: No SCM system was detected. You can use the 'sonar.scm.provider' property to explicitly specify it.
INFO: Calculating CPD for 1 file
INFO: CPD calculation finished
INFO: Analysis report generated in 189ms, dir size=83 KB
INFO: Analysis report compressed in 17ms, zip size=14 KB
INFO: Analysis report uploaded in 1437ms
INFO: ANALYSIS SUCCESSFUL, you can browse http://10.0.1.102:9000/dashboard?id=org.sonarqube%3Aphp-simple-sq-scanner
INFO: Note that you will be able to access the updated dashboard once the server has processed the submitted analysis report
INFO: More about the report processing at http://10.0.1.102:9000/api/ce/task?id=AXfzlFbUEMwg_dNR3M3w
INFO: Analysis total time: 13.302 s
INFO: ------------------------------------------------------------------------
INFO: EXECUTION SUCCESS
INFO: ------------------------------------------------------------------------
INFO: Total time: 21.257s
INFO: Final Memory: 8M/40M
INFO: ------------------------------------------------------------------------
[root@jenkins php-sonar-runner]$

web 看测试结果:

jenkins 执行代码扫描

上面是命令行执行 sonar-scanner 命令进行测试,可以结合 jenkins 进行测试,无非就是将命令写到脚本里,让 jenkins 自动执行

官方网站: https://jenkins.io/zh/

Jenkins 是开源 CI&CD 软件领导者, 提供超过 1000 个插件来支持构建、部署、自动化, 满足任何项目的需要。

部署 jenkins

Jenkins 支持各种运行方式,可通过系统包、Docker 或者通过一个独立的 Java 程序

安装 JDK

Jenkins 基于 JAVA 实现,安装 Jenkins 前需要先安装 JDK

1
2
3
4
[root@jenkins ~]$java -version
java version "1.8.0_271"
Java(TM) SE Runtime Environment (build 1.8.0_271-b09)
Java HotSpot(TM) 64-Bit Server VM (build 25.271-b09, mixed mode)

安装 jenkins

1
2
3
4
5
$wget https://mirrors.tuna.tsinghua.edu.cn/jenkins/debian-stable/jenkins_2.263.4_all.deb # 清华源下载dep包
[root@jenkins src]$apt install daemon # 依赖的包,如果没有,会报错,所以提前装上
[root@jenkins src]$ln -s /usr/local/jdk/bin/java /usr/bin/java # Jenkins只会在/bin:/usr/bin:/sbin:/usr/sbin找java,所以设置$PATH不好使,得做个软连接

[root@jenkins src]$dpkg -i jenkins_2.263.4_all.deb # 安装

主要文件:

1
2
3
4
5
6
7
/etc/default/jenkins
/etc/init.d/jenkins
/etc/logrotate.d/jenkins
/usr/share/jenkins/jenkins.war # 实际上就是启动这个war包
/var/cache/jenkins/
/var/lib/jenkins/
/var/log/jenkins/

修改 jenkins 服务的用户

默认 jenkins 服务使用 jenkins 帐号启动,将文件复制到生产服务器可能会遇到权限问题,需要先 su 到对应的用户,这里学习环境为了方便,修改为 root 用户,注意:工作中还是使用 jenkins 普通用户

1
2
3
4
5
[root@jenkins src]$vim /etc/default/jenkins
#JENKINS_USER=$NAME
#JENKINS_GROUP=$GROUP
JENKINS_USER=root # 直接修改为root,不要修改$NAME变量
JENKINS_GROUP=root

访问 jenkins 页面

创建管理员用户

先创建用户,然后使用刚创建的用户登录

安装插件

Jenkins 是完全插件化的服务,我们想实现什么功能,不是改配置文件,而是下载插件

修改更新源为国内清华源:

1
2
3
4
5
6
7
8
9
[root@jenkins src]$cat /var/lib/jenkins/hudson.model.UpdateCenter.xml
<?xml version='1.1' encoding='UTF-8'?>
<sites>
<site>
<id>default</id>
<url>https://mirrors.tuna.tsinghua.edu.cn/jenkins/updates/update-center.json</url>
</site>
</sites>
[root@jenkins src]$systemctl restart jenkins.service

有以下几种安装插件的方式:

  • 在线安装:官网,也是默认的方式,比较慢

  • 在线安装:清华大学镜像源,sed 或者编辑器把 update-center.json 中的 Jenkins 网址替换为清华源

    1
    2
    3
    4
    # 将:
    https://updates.jenkins.io/download/plugins/warnings/5.0.1/warnings.hpi
    # 替换为:
    https://mirrors-i.tuna.tsinghua.edu.cn/jenkins/plugins/warnings/5.0.1/warnings.hpi
  • 离线安装:手动下载插件,然后放到 /var/lib/jenkins/plugins/,重启 Jenkins 即可

  • 通过 web 界面安装

搜索需要 gitlab(和 gitlab 相连)和 Blue Ocean(显示信息更加好看)的相关插件并安装

配置 jenkins 权限管理

默认 jenkins 用户可以执行所有操作,为了更好的分层控制,可以实现基于角色的权限管理,先创建角色和用户,给角色授权,然后把用户管理到角色

安装插件

安装插件:Role-based Authorization Strategy

如果直接下载失败,可以直接清华源下载,将插件放在 /var/lib/jenkins/plugins 目录下

创建新用户

新建 xiaoming 和 xiaogang 两个用户:

更改认证方式

新建任务

通常选择“构建一个自由风格的软件项目”,新建四个任务:test1-job1、test1-job2、test2-job1、test2-job2

创建角色并对角色分配权限

  1. 创建全局角色
    创建全局读角色,只有读权限

  2. 创建 item 角色
    创建两个 item 角色,test1-role、test2-role,通过正则匹配分配任务

将用户关联到角色

测试普通用户登录

xiaogang 用户只能看到 test1.* 匹配的项目:test1-job1、test1-job2

xiaoming 用户只能看到 test2.*匹配的项目:test2-job1、test2-job2

jenkins 邮箱配置

邮件发送到组邮件地址,组邮件会转发到组内所有人

配置 jenkins 到 gitlab 非交互式拉取代码

需要配置 ssh key (公钥)和 凭据(私钥)

配置 ssh key

实现 jenkins 服务器到 gitlab 服务器的基于密钥的验证,可以让 jenkins 连接到 gitlab 执行操作

  1. 在 jenkins 服务上生成 ssh key
  2. 在 gitlab 服务器上添加上面生成的 ssh key
  3. 在 jenkins 服务器上测试 ssh key

配置凭据

凭据就是私钥,clone 项目的时候,可选择不同的凭据(私钥),只要他在 gitlab 上配置了 key(公钥),如果不指定,就以当前用户的私钥作为凭据去 clone 项目

管理凭据:系统管理 -> 安全 -> Manage Credentials

构建触发器

构建触发器(webhook),有的人称为钩子,实际上是一个 HTTP 回调,其用于在开发人员向 gitlab 提交代码后能够触发 jenkins 自动执行代码构建操作

以下为新建一个开发分支,只有在开发人员向开发(develop)分支提交代码的时候才会触发代码构建,而向主分支提交的代码不会自动构建,需要运维人员手动部署代码到生产环境

生产中千万不要用,测试一般也不用,都是由开发登陆自己的账号,只能看到自己的 job,然后开发自己手动部署

项目关联

用于多个 job 相互关联,需要串行执行多个 job 的场景,不过这个操作基本不用

例如:克隆代码、编译代码、停止 tomcat、部署代码、启动 tomcat 这些操作使用不同的 job 执行,这些 job 需要串行执行

视图

job 太多需要分类

视图可用于归档 job 进行分组显示,比如将一个业务的 job 放在一个视图显示,最常用的是列表视图

jenkins 分布式

在众多 Job 的场景下,单台 jenkins master 同时执行代码 clone、编译、打包及构建,其性能可能会出现瓶颈从而会影响代码部署效率,影响 jenkins 官方提供了 jenkins 分布式构建,将众多 job 分散运行到不同的 jenkins slave 节点,大幅提高并行 job 的处理能力

配置 slave 节点环境

slave 节点需要配置与 master 一样的基础运行环境,另外也要创建与 master 相同的数据目录,因为脚本中调用的路径只有相对于 master 的一个路径,此路径在 master 与各 node 节点必须保持一致

1
2
3
4
5
6
7
8
9
10
# 配置java环境
[root@jenkins-slave1 ~]$java -version
java version "1.8.0_271"
Java(TM) SE Runtime Environment (build 1.8.0_271-b09)
Java HotSpot(TM) 64-Bit Server VM (build 25.271-b09, mixed mode)

[root@jenkins-slave1 ~]$ln -s /usr/local/jdk/bin/java /usr/bin/java

# 创建数据目录
[root@jenkins-slave1 ~]$mkdir -p /var/lib/jenkins

添加 slave 节点

可以限制项目只能在指定的节点中执行:

流水线 pipline

流水线 pipline 是 Jenkins 中的头等公民,官方介绍;https://www.jenkins.io/zh/doc/book/pipeline/

本质上,Jenkins 是一个自动化引擎,它支持许多自动模式。 流水线向 Jenkins 中添加了一组强大的工具, 支持用例 简单的持续集成到全面的 CD 流水线。通过对一系列的相关任务进行建模, 用户可以利用流水线的很多特性:

  • 代码:流水线是在代码中实现的,通常会检查到源代码控制,使团队有编辑,审查和迭代他们的交付流水线的能力
  • 可持续性:jenkins 的重启或者中断后不影响已经执行的 Pipline Job
  • 支持暂停:pipline 可以选择停止并等待人工输入或批准后再继续执行
  • 可扩展:通过 groovy 的编程更容易的扩展插件
  • 并行执行:通过 groovy 脚本可以实现 step,stage 间的并行执行,和更复杂的相互依赖关系

流水线概念

流水线 pipeline

流水线是用户定义的一个 CD 流水线模型 。流水线的代码定义了整个的构建过程, 他通常包括构建, 测试和交付应用程序的阶段

节点 node

每个 node 都是一个 jenkins 节点,可以是 jenkins master 也可以是 jenkins agent,node 是执行 step 的具体服务器

阶段 stage

一个 pipline 可以划分为若干个 stage,每个 stage 都是一个操作,比如 clone 代码、代码编译、代码测试和代码部署,阶段是一个逻辑分组,可以跨多个 node 执行

步骤 step

step 是 jenkins pipline 最基本的操作单元,从在服务器创建目录到构建容器镜像,由各类 Jenkins 插件提供实现,例如: sh “make”

流水线语法概述

对 Jenkins 流水线的定义被写在一个文本文件中: Jenkinsfile,该文件可以被提交到项目的源代码的控制仓库。 这是”流水线即代码”的基础;将 CD 流水线作为应用程序的一部分,像其他代码一样进行版本化和审查。

Jenkinsfile 能使用两种语法进行编写,声明式和脚本化。

声明式和脚本化的流水线从根本上是不同的。 声明式流水线的是 Jenkins 流水线更近的特性

声明式流水线基础

在声明式流水线语法中, pipeline 块定义了整个流水线中完成的所有的工作。

示例:

1
2
3
4
5
6
7
8
9
10
11
12
13
14
15
16
17
18
19
20
21
22
Jenkinsfile (Declarative Pipeline)
pipeline {
agent any
stages {
stage('Build') {
steps {
sh 'make'
}
}
stage('Test'){
steps {
sh 'make check'
junit 'reports/**/*.xml'
}
}
stage('Deploy') {
steps {
sh 'make publish'
}
}
}
}
  • pipeline 是声明式流水线的一种特定语法,他定义了包含执行整个流水线的所有内容和指令的 “block” 。
  • agent 是声明式流水线的一种特定语法,它指示 Jenkins 为整个流水线分配一个执行器 (在节点上)和工作区。
  • stage 是一个描述 stage of this Pipeline 的语法块。在 Pipeline syntax 页面阅读更多有关声明式流水线语法的stage块的信息。如 above 所述, 在脚本化流水线语法中,stage 块是可选的。
  • steps 是声明式流水线的一种特定语法,它描述了在这个 stage 中要运行的步骤。
  • sh 是一个执行给定的 shell 命令的流水线 step (由 Pipeline: Nodes and Processes plugin 提供) 。
  • junit 是另一个聚合测试报告的流水线 step (由 JUnit plugin 提供)。
  • node 是脚本化流水线的一种特定语法,它指示 Jenkins 在任何可用的代理/节点上执行流水线 (和包含在其中的任何阶段)这实际上等效于 声明式流水线特定语法的agent

脚本化流水线基础

pipline 语法

官方文档:https://www.jenkins.io/zh/doc/book/pipeline/syntax/

pipline job

创建 pipline job

测试简单 pipline job 运行

1
2
3
4
5
6
7
8
9
10
11
12
13
14
node {
stage('clone 代码') {
echo '代码 clone'
}
stage('代码构建') {
echo '代码构建'
}
stage('代码测试') {
echo '代码测试'
}
stage('代码部署') {
echo '代码部署'
}
}

立即构建,查看输出信息:

自动生成拉取代码的 pipline 脚本

案例

说明

1
2
3
4
5
6
master分支:稳定的分支
develop分支:开发分支

lujinkai:开发人员分支
xiaoming:开发人员分支
...

master 分支是上线的代码,develop 是开发中的代码,lujinkai、xiaoming 等是开发人员分支,开发在自己的分支里面写代码,然后下班前提交、合并到 develop 分支,等项目开发、测试完,最后再合并到 master 分支,然后上线

常用命令

1
2
3
4
5
6
7
8
9
10
11
12
13
14
15
16
17
18
19
20
21
22
23
24
25
[root@kafka2 testproject]$git branch  # 查看本地分支
* master # 分支前标 * 表示当前处于的分支

[root@kafka2 testproject]$git branch -a # 查看所有分支
* master
remotes/origin/HEAD -> origin/master
remotes/origin/ludongsheng
remotes/origin/master

git status # 查看工作区的状态
git branch test # 创建test分支
git merge test # 将test分支合并到当前分支
git log # 查看操作日志
git reflog # 获取每次提交的ID,可以使用--hard根据提交的ID进行版本回退

vim .gitignore # 定义忽略文件,即不放在仓库的文件

git reset --hard HEAD^^ # git版本回滚, HEAD为当前版本,加一个^为上一个,^^为上上一个版本

git reset --hard 5ae4b06 # 回退到指定id的版本

git checkout -b develop # 创建并切换到一个新分支
git checkout develop # 切换分支

git clone -b 分支名 仓库地址 # clone指定分支的代码

流程

  1. 在 gitlab 创建个人分支 lujinkai

  2. 克隆 master 分支到本地

    1
    [root@dev ~]$git clone git@gitlab.ljk.local:testgroup/testproject.git
  3. 切换到自己分支

    1
    [root@dev ~]$git checkout lujinkai
  4. 将 develop 分支拉下来和个人分支合并

    1
    2
    3
    4
    [root@dev ~]$git pull origin develop

    # git pull <远程主机名> <远程分支名>:<本地分支名>
    # 如果与当前分支合并,则冒号后面的部分可以省略

    以上命令是把远程分支 develop 拉下来,然后合并到当前分支 lujinkai,或者可以拆分成以下步骤:

    1
    2
    3
    4
    git checkout develop   # 切换到分支develop
    git pull origin develop # 远程develop拉下来和本地develop合并
    git checkout lujinkai # 切换到分支lujinkai
    git merge develop --no-commit # 将本地分支develop和当前分支lujinkai合并
  5. 开发代码

  6. 下班了,需要提交代码,但是在提交之前最好再执行一遍上一步,因为在你写代码的过程中,develop 分支可能有其他人提交

    1
    [root@dev ~]$git pull origin develop
  7. 添加文件到本地缓存区

    1
    [root@dev ~]$git add .  # . 表示当前目录下的所有文件
  8. 提交内容到本地分支上

    1
    git commit -m "注释, 提交说明"
  9. 上传本地分支到远程分支

    1
    2
    3
    4
    git push

    # 默认提交到本地分支对应的远程分支,或者可以显式指定
    git push origin lujinkai

之后每天 3 - 9 步骤走一遍

清除 master 分支的 commit 记录

  1. 克隆仓库 (这时工作目录里是 master 分支最后一次提交的内容)
  2. 创建一个新的空的分支
  3. 添加工作目录里所有文件到新的分支并做一次提交
  4. 删除 master 分支
  5. 将新的分支更名为 master
  6. 强制更新到 github 仓库
1
2
3
4
5
6
7
git clone [URL] && cd [仓库名]           # 克隆git仓库,进入仓库
git checkout --orphan new_branch # 创建一个新的空的分支
git add -A # 添加工作目录里所有文件到新的分支
git commit -am 'v1' # 做一次提交
git branch -D master # 删除master分支
git branch -m master # 将新的分支更名为master
git push origin master --force # 强制更新到github仓库

DevOps

DevOps 是 Development 和 Operations 的组合,也就是开发和运维的简写

什么是持续集成(CI-Continuous integration)

持续集成是指多名开发者在开发不同功能代码的过程当中,可以频繁的将代码行合并到一起并切相互不影响工作

什么是持续部署(CD-continuous deployment)

是基于某种工具或平台实现代码自动化的构建、测试和部署到线上环境以实现交付高质量的产品,持续部署在某种程度上代表了一个开发团队的更新迭代速率

什么是持续交付(Continuous Delivery)

持续交付是在持续部署的基础之上,将产品交付到线上环境,因此持续交付是产品价值的一种交付,是产品价值的一种盈利的实现

GitLab

GitLab 和 GitHub 一样属于第三方基于 Git 开发的作品,免费且开源,与 Github 类似,可以注册用户,任意提交你的代码,添加 SSHKey 等等。不同的是,GitLab 是可以部署到自己的服务器上,简单来说可把 GitLab 看作个人版的 GitHub

Git 在每个用户都有一个完整的服务器,然后再有一个中央服务器,用户可以先将代码提交到本地,没有网络也可以先提交到本地,然后在有网络的时候再提交到中央服务器,这样就大大方便了开发者,而相比 CVS 和 SVN 都是集中式的版本控制系统,工作的时候需要先从中央服务器获 取最新的代码,改完之后需要提交,如果是一个比较大的文件则需要足够快的网络才能快速提交完成,而使用分布式的版本控制系统,每个用户都是一个完整的版本库,即使没有中央服务器也可以提交代码或者回滚,最终再把改好的代码提交至中央服务器进行合并即可

SVN

每次提交的文件都单独保存, 即按照文件的提交时间区分不同的版本, 保存至不同的逻辑存储区域,后期恢复时候直接基于之前版本恢复。


Git

Gitlab 与 SVN 的数据保存方式不一样,gitlab 虽然 也会在内部 对数据进行逻辑划分保存,但是当后期提交的数据如和之前交的数据没有变化,其就直接 快照之前的文件 ,而不是再将文件重新上传一份再保存一遍,这样既节省 了空间又加快了代码提交速度 。

git 缓存区与工作区等概念

  • 工作区 :clone 的代码或者开发自己编写代码文件所在 的目录 ,通常是代码所在的一 个服务的目录名称
  • 暂存区 :用于存储在工作区中对代码进行修改后的文件所保存的地方,使用 git add 添加
  • 本地仓库: 用于提交存储在工作区和暂存区中改过的文件地方,使 git commit 提交
  • 远程仓库 :多个开发人员共同协作提交代码的仓库,即 gitlab 服务器

Gitlab 部署与使用

测试环境:内存 4G 以上
生产环境:建议 CPU2C,内存 8G,磁盘 10G 以上配置,和用户数有关

清华源 centos7:https://mirrors.tuna.tsinghua.edu.cn/gitlab-ce/yum/el7/
清华源 ubuntu18.04:https://mirrors.tuna.tsinghua.edu.cn/gitlab-ce/ubuntu/pool/bionic/main/g/gitlab-ce/

安装

1
2
3
4
[root@gitlab src]$dpkg -i gitlab-ce_13.8.4-ce.0_amd64.deb # 得等一会
...
configuration in /etc/gitlab/gitlab.rb file. # 配置文件
...

配置

1
2
3
4
5
6
7
8
9
10
11
12
13
14
# 需要配置gitlab服务器地址和邮件地址
[root@gitlab src]$vim /etc/gitlab/gitlab.rb
external_url 'http://gitlab.ljk.local' # 修改此行
# 增加下面行,可选邮件通知设置
gitlab_rails['smtp_enable'] = true
gitlab_rails['smtp_address'] = "smtp.qq.com"
gitlab_rails['smtp_port'] = 465
gitlab_rails['smtp_user_name'] = "441757636@qq.com"
gitlab_rails['smtp_password'] = "jwopcvnpcawdabbg"
gitlab_rails['smtp_domain'] = "qq.com"
gitlab_rails['smtp_authentication'] = "login"
gitlab_rails['smtp_enable_starttls_auto'] = true
gitlab_rails['smtp_tls'] = true
gitlab_rails['gitlab_email_from'] = "441757636@qq.com"

gitlab 相关目录:

1
2
3
4
5
/etc/gitlab      #配置文件目录
/run/gitlab #运行pid目录
/opt/gitlab #安装目录
/var/opt/gitlab #数据目录
/var/log/gitlab #日志目录

初始化服务

修改完配置文件要执行此操作

1
[root@gitlab src]$gitlab-ctl reconfigure

常用命令:

1
2
3
4
5
6
7
8
9
10
gitlab-rails          #用于启动控制台进行特殊操作,如修改管理员密码、打开数据库控制台( gitlab-rails dbconsole)等
gitlab-psql #数据库命令行
gitlab-rake #数据备份恢复等数据操作

gitlab-ctl #客户端命令行操作行
gitlab-ctl stop #停止gitlab
gitlab-ctl start #启动gitlab
gitlab-ctl restart #重启gitlab
gitlab-ctl status #查看组件运行状态
gitlab-ctl tail nginx #查看某个组件的日志

gitlab web 界面

username:root
注意,使用域名访问需要做 hosts

关闭账号注册

默认情况下可以直接注册账号,一般都关闭此功能,由管理员统一注册用户

修改邮箱地址

新添加的邮箱不是默认的通知邮箱,下面是设置新邮箱为默认邮箱

设置完后,需要重新登录才能生效,然后可以把之前的默认邮箱删除

创建 gitlab 账户

创建成功后,需要查看邮件,在邮件链接中重置密码

创建组

使用管理员 root 创建组,一个组里面可以有多个项目分支,可以将开发添加到组里,再进行设置权限,不同的组对应公司不同的开发项目或者服务模块,不同的组中添加不同的开发人员帐号,即可实现对开发设置权限的管理

管理员创建项目

有三种方式:创建空项目、使用模板、导入项目

将用户添加到组

更多权限:https://docs.gitlab.com/ee/user/permissions.html

gitlab 仓库 developer 权限无法 push

默认 develop 权限无法 merge 和 push 到 master 分支的,可以修改:

在这里,也可以设置也可以保护其他分支

在项目中新建测试页面

使用 陆东生 用户登录,新建分支,继承自 master:

git 客户端测试 clone 项目

  1. ssh 认证

    1
    2
    ssh-keygen -t rsa
    cat ~/.ssh/id_rsa.pub # 将公钥复制到给gitlab
  2. clone

    1
    git clone git@gitlab.ljk.local:testgroup/testproject.git

git 常用命令

运维常用:git pullgit clonegit reset

.gitignore

有些文件不需要上传,在 .gitignore 文件中设置忽略规则,示例:

1
2
3
4
5
6
7
8
9
10
# 项目根目录下创建.gitignore,规则如下:忽略.vscode目录和.gitignore文件
$ cat .gitignore
/.vscode/
.gitignore

# 在src目录下创建.gitignore文件,规则如下:忽略全部,只保留.gitignore
# 目的是只保留src空目录
$ cat ./src/.gitignore
*
!.gitignore

修改完 .gitignore 文件后,更新缓存:

1
2
git rm -r --cached .
git add .

gitlab 数据备份恢复

  1. 备份前必须先停止 gitlab 两个服务

    1
    2
    [root@gitlab ~]$gitlab-ctl stop unicorn
    [root@gitlab ~]$gitlab-ctl stop sidekiq
  2. 备份数据

    1
    2
    3
    4
    5
    6
    7
    8
    9
    [root@gitlab ~]$gitlab-rake gitlab:backup:create
    ...
    Warning: Your gitlab.rb and gitlab-secrets.json files contain sensitive data
    and are not included in this backup. You will need these files to restore a backup.
    Please back them up manually.

    # 以上warning表示gitlab.rb和gitlab-secrets.json两个文件包含敏感信息。未被备份到备份文件中。需要手动备份,这两个文件位于 /etc/gitlab

    [root@gitlab ~]$gitlab-ctl start # 备份完成后启动gitlab

    备份数据位于 /var/opt/gitlab/backups/

    1
    2
    [root@gitlab ~]$ls /var/opt/gitlab/backups/
    1614392268_2021_02_27_13.8.4_gitlab_backup.tar
  3. 查看要恢复的文件

    1
    2
    3
    /var/opt/gitlab/backups/   # Gitlab数据备份目录,需要使用命令备份的
    /var/opt/gitlab/nginx/conf # nginx配置文件
    /etc/gitlab/gitlab.rb # gitlab配置文件
  4. 删除项目和用户信息

  5. 执行恢复

    1
    2
    3
    4
    5
    # 恢复前先停止两个服务
    [root@gitlab ~]$gitlab-ctl stop unicorn
    [root@gitlab ~]$gitlab-ctl stop sidekiq
    # 恢复时指定备份文件的时间部分,不需要指定文件的全名
    [root@gitlab ~]$gitlab-rake gitlab:backup:restore BACKUP=备份文件名
  6. 恢复后再将之前停止的两个服务启动

    1
    gitlab-ctl start

gitlab 汉化

虽然不推荐,但是有需求,基于第三方开发爱好者实现

汉化包地址: https://gitlab.com/xhang/gitlab

1
2
3
4
5
6
7
8
9
10
git clone https://gitlab.com/xhang/gitlab.git
head -1 /opt/gitlab/version-manifest.txt # 查看当前gitlab版本
cd gitlab
git diff v11.9.8 v11.9.8-zh
git diff v11.9.8 v11.9.8-zh >/root/v11.9.8-zh.diff
gitlab-ctl stop
patch -f -d /opt/gitlab/embedded/service/gitlab-rails -p1 </root/v11.9.8-zh.diff
gitlab-ctl reconfigure
gitlab-ctl start
gitlab-ctl status

常见的代码部署方式

蓝绿部署

不停老版本代码(不影响上一个版本访问),而是在另外一套环境部署新版本然后进行测试,测试通过后将用户流量切到新版本,其特点为业务无中断,升级风险相对较小

具体过程:

  1. 当前版本业务正常访问(V1)
  2. 在另外一套环境部署新代码(V2),代码可能是增加了功能或者是修复了某些 bug
  3. 测试通过之后将用户请求流量切到新版本环境
  4. 观察一段时间,如有异常直接切换旧版本,没有异常就删除老版本
  5. 下次升级,将旧版本升级到新版本(V3)

金丝雀发布

金丝雀发布也叫灰度发布,是指在黑与白之间,能够平滑过渡的一种发布方式,灰度发布是增量发布的一种类型,灰度发布是在原有版本可用的情况下,同时部署一个新版本应用作为“金丝雀”(小白鼠),测试新版本的性能和表现,以保障整体系统稳定的情况下,尽早发现、调整问题。因此,灰度发布可以保证整体系统的稳定,在初始灰度的时候就可以发现、调整问题,以保证其影响度

具体过程:

  1. 准备好部署各个阶段的工件,包括:构建组件,测试脚本,配置文件和部署清单文件。
  2. 从负载均衡列表中移除掉“金丝雀”服务器。
  3. 升级“金丝雀”应用(排掉原有流量并进行部署)。
  4. 对应用进行自动化测试。
  5. 将“金丝雀”服务器重新添加到负载均衡列表中(连通性和健康检查)。
  6. 如果“金丝雀”在线使用测试成功,升级剩余的其他服务器。(否则就回滚)

滚动发布

滚动发布,一般是取出一个或者多个服务器停止服务,执行更新,并重新将其投入使用。周而复始,直到集群中所有的实例都更新成新版本,此方式可以防止同时升级,造成服务停止

A/B 测试

A/B 测试也是同时运行两个 APP 环境,但是和蓝绿部署完全是两码事,A/B 测试是用来测试应用功能表现的方法,例如可用性、受欢迎程度、可见性等等,蓝绿部署的目的是安全稳定地发布新版本应用,并在必要时回滚,即蓝绿部署是同一时间只有一套正式环境环境在线,而 A/B 测试是两套正式环境同时在线,一般用于多个产品竟争时使用

Nexus 是一个强大的 Maven 仓库管理器,它极大地简化了自己内部仓库的维护和外部仓库的访问

官方下载:https://help.sonatype.com/repomanager3/download/download-archives---repository-manager-3

部署 Nexus

  1. 下载、解压、创建用户

    1
    2
    3
    4
    5
    6
    7
    8
    [root@nexus src]$useradd -r -s /sbin/nologin nexus  # 创建nexus用户
    [root@nexus src]$tar zxf nexus-3.29.2-02-unix.tar.gz
    [root@nexus src]$mv nexus-3.29.2-02 /usr/local/nexus
    [root@nexus src]$mv sonatype-work/ /usr/local/
    [root@nexus src]$cd /usr/local/
    [root@nexus local]$chown -R nexus:nexus ./nexus/
    [root@nexus local]$chown -R nexus:nexus ./sonatype-work/
    [root@nexus local]$echo 'nexus - nofile 65536' >> /etc/security/limits.conf
  2. Service 启动文件,官方提供

    1
    2
    3
    4
    5
    6
    7
    8
    9
    10
    11
    12
    13
    14
    15
    16
    17
    18
    [root@nexus ~]$cat /lib/systemd/system/nexus.service
    [Unit]
    Description=nexus service
    After=network.target

    [Service]
    Type=forking
    LimitNOFILE=65536
    ExecStart=/usr/local/nexus/bin/nexus start
    ExecStop=/usr/local/nexus/bin/nexus stop
    User=nexus
    Restart=on-abort
    TimeoutSec=600

    [Install]
    WantedBy=multi-user.target

    [root@nexus ~]$systemctl start nexus.service # 需要几分钟时间启动
  3. 设置向导:

  4. 验证默认仓库

    • Hosted:本地仓库,通常我们会部署自己的构件到这一类型的仓库,比如公司的第三方库
    • Proxy:代理仓库,它们被用来代理远程的公共仓库,如 maven 中央仓库(官方仓库)
    • Group:仓库组,用来合并多个 hosted/proxy 仓库,当你的项目希望在多个 repository 使用资源时就不需要多次引用了,只需要引用一个 group 即可

构建私有 yum 仓库

  1. 配置仓库的数据目录

  2. 仓库配置,以 zabbix 为例

  3. centos 7.x 配置 yum 仓库

    1
    2
    3
    4
    5
    6
    7
    [root@c71 ~]$vim /etc/yum.repos.d/zabbix.repo
    [root@c71 ~]$cat /etc/yum.repos.d/zabbix.repo
    [zabbix-nexus]
    name=zabbix
    baseurl=http://10.0.1.103:8081/repository/zabbix-proxy/
    enabled=1
    gpgcheck=0
  4. 测试:

  5. 下载过的包会缓存下来

数据备份

Nexus 中普通数据信息和元数据是分开存储的,普通数据是保存在 blob 中,而元数据保存在数据库中,所以在备份的时候必须同时进行备份普通数据和元数据,才能在后期恢复数据的时候保证数据的最终完整性

数据量太大,而且不影响用户业务,数据备份没什么意义

http://activemq.apache.org/

ActiveMQ 是一种开源的基于 JMS(Java Message Servie)规范的一种消息中间件的实现,采用 Java 开发,设计目标是提供标准的、面向消息的、能够跨越多语言和多系统的应用集成消息通信中间件