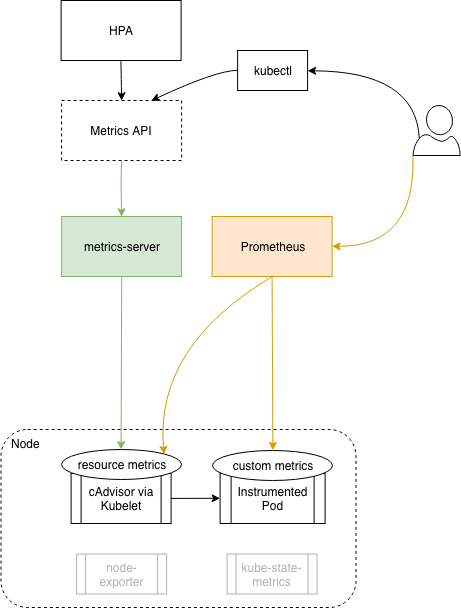
metrics Server 提供核心监控指标,比如 Node 节点的 CPU 和内存使用率,其他的监控交由 Prometheus 组件完成
简介 官网:https://prometheus.io/docs/introduction/overview/ https://github.com/prometheus
prometheus 是基于 go 语言开发的一套开源的监控、报警和时间序列数据库的组合,是由 SoundCloud 公司开发的
1
2
3
4
5
6
7
- 使用 key-value 的多维度格式保存数据 - 数据不使用 MySQL 这样的传统数据库,而是使用时序数据库,目前是使用的 TSDB - 支持第三方 dashboard 实现更高的图形界面,如 grafana(Grafana 2.5.0版本及以上) - 功能组件化 - 不需要依赖存储,数据可以本地保存也可以远程保存 - 服务自动化发现 - 强大的数据查询语句功(PromQL:Prometheus Query Language)
TSDB TSDB:Time Series Database,时间序列数据库,简称时序数据库
什么是时序数据库?顾名思义,就是存储与时间相关的数据,该数据是在时间上分布的一系列值
时序数据库被广泛应用于物联网和运维监控系统
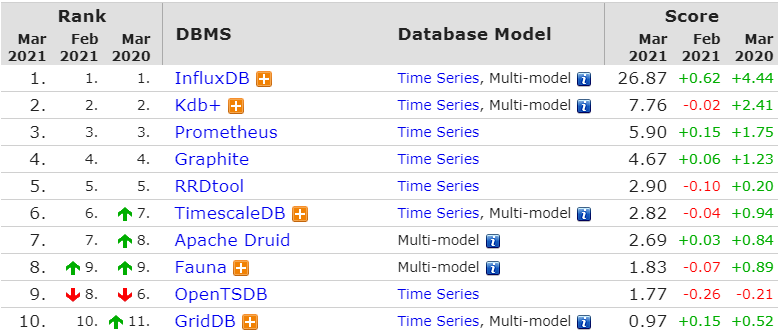
这个网站 可以查看各种时序数据库的排名:
1
2
3
4
5
6
7
小而精,性能高,数据量较小(亿级): InfluxDB 简单,数据量不大(千万级),有联合查询、关系型数据库基础:timescales 数据量较大,大数据服务基础,分布式集群需求: opentsdb、KairosDB 分布式集群需求,olap实时在线分析,资源较充足:druid 性能极致追求,数据冷热差异大:Beringei 兼顾检索加载,分布式聚合计算: elsaticsearch 如果你兼具索引和时间序列的需求。那么Druid和Elasticsearch是最好的选择。其性能都不差,同时满足检索和时间序列的特性,并且都是高可用容错架构。
阿里云版 TSDB,文档写的还不错:https://help.aliyun.com/product/54825.html
Prometheus 内置了 TSDB,目前是 V3.0 版本,是一个独立维护的 TSDB 开源项目;在单机上,每秒可处理数百万个样本
Prometheus TSDB 数据存储格式:
以每 2 小时为一个时间窗口,并存储为一个单独的 block
block 会压缩、合并历史数据块,随着压缩合并,其 block 数量会减少
block 的大小并不固定,但最小会保存两个小时的数据
P137
PromQL https://songjiayang.gitbooks.io/prometheus/content/promql/summary.html
PromQL:Prometheus Query Language,是 Prometheus 自己开发的数据查询 DSL 语言,语言表现力非常丰富,内置函数很多,在日常数据可视化以及 rule 告警中都会使用到它
系统架构
1
2
3
4
5
6
prometheus server:主服务,接受外部http请求,收集、存储与查询数据等 prometheus targets: 静态收集的目标服务数据 service discovery:动态发现服务 prometheus alerting:报警通知 push gateway:数据收集代理服务器(类似于zabbix proxy) data visualization and export: 数据可视化与数据导出(访问客户端)
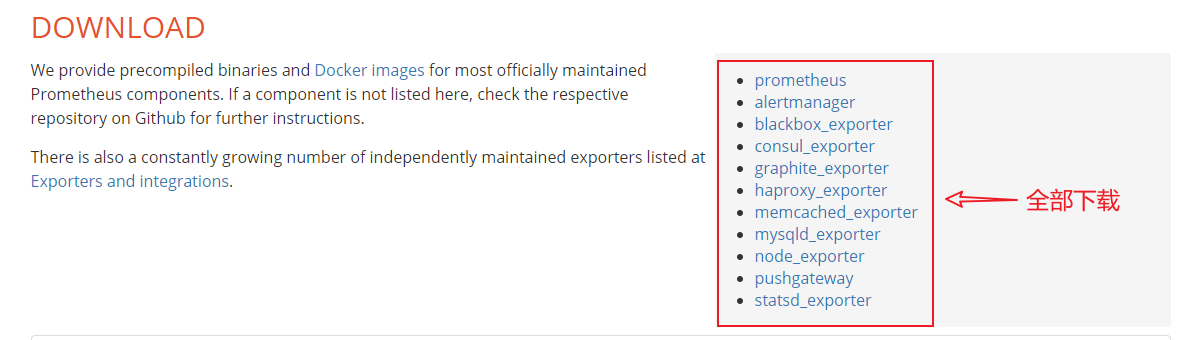
安装 三种安装方式:docker、二进制、operator
1
2
3
https://prometheus.io/download/ https://prometheus.io/docs/prometheus/latest/installation/ https://github.com/coreos/kube-prometheus
一般不使用 docker 安装,推荐 operator,但是 operator 安装会隐藏很多细节,所以要先学习二进制安装
1
2
3
4
5
6
7
8
9
10
11
https://github.com/prometheus/prometheus/releases/download/v2.25.2/prometheus-2.25.2.linux-amd64.tar.gz https://github.com/prometheus/alertmanager/releases/download/v0.21.0/alertmanager-0.21.0.linux-amd64.tar.gz https://github.com/prometheus/blackbox_exporter/releases/download/v0.18.0/blackbox_exporter-0.18.0.linux-amd64.tar.gz https://github.com/prometheus/consul_exporter/releases/download/v0.7.1/consul_exporter-0.7.1.linux-amd64.tar.gz https://github.com/prometheus/graphite_exporter/releases/download/v0.9.0/graphite_exporter-0.9.0.linux-amd64.tar.gz https://github.com/prometheus/haproxy_exporter/releases/download/v0.12.0/haproxy_exporter-0.12.0.linux-amd64.tar.gz https://github.com/prometheus/memcached_exporter/releases/download/v0.8.0/memcached_exporter-0.8.0.linux-amd64.tar.gz https://github.com/prometheus/mysqld_exporter/releases/download/v0.12.1/mysqld_exporter-0.12.1.linux-amd64.tar.gz https://github.com/prometheus/node_exporter/releases/download/v1.1.2/node_exporter-1.1.2.linux-amd64.tar.gz https://github.com/prometheus/pushgateway/releases/download/v1.4.0/pushgateway-1.4.0.linux-amd64.tar.gz https://github.com/prometheus/statsd_exporter/releases/download/v0.20.0/statsd_exporter-0.20.0.linux-amd64.tar.gz
prometheus server 1 2 3 4 5 6 7 8 9 10 11 12 13 14 15 16 17 18 19 20 [root@k8s-master src]$tar zxf prometheus-2.25.2.linux-amd64.tar.gz [root@k8s-master src]$mv prometheus-2.25.2.linux-amd64 /usr/local/prometheus [root@k8s-master src]$cd /usr/local/prometheus/ [root@k8s-master prometheus]$vim /lib/systemd/system/prometheus.service [Unit] Description=Prometheus Server Documentation=https://prometheus.io/docs/introduction/overview/ After=network.target [Service] Restart=on-failure WorkingDirectory=/usr/local/prometheus/ ExecStart=/usr/local/prometheus/prometheus -- config.file=/usr/local/prometheus/prometheus.yml [Install] WantedBy=multi-user.target [root@k8s-master prometheus]$systemctl daemon-reload [root@k8s-master prometheus]$systemctl start prometheus.service
node exporter 收集各 k8s node 节点上的监控指标数据,监听端口为 9100
node exporter 和 metrics server :
原理都是一样的,都是从 node 的 kublete 获取数据,但是 node exporter 从本机的 kubelet 获取数据,metrics server 从所有 node 的 kubelet 获取数据,所以 node exporter 需要在每个 node 都部署一份,而 metrics server 只部署一个就可以
安装:
在每个 node 都执行以下安装步骤:
1 2 3 4 5 6 7 8 9 10 11 12 13 14 15 16 17 18 $tar zxf node_exporter-1.1.2.linux-amd64.tar.gz$mv node_exporter-1.1.2.linux-amd64 /usr/local/node_exporter$cd /usr/local/node_exporter/$vim /etc/systemd/system/node-exporter.service[Unit] Description=Prometheus Node Exporter After=network.target [Service] ExecStart=/usr/local/node_exporter/node_exporter [Install] WantedBy=multi-user.target $systemctl daemon-reload$systemctl start node-exporter.service$ss -ntlp | grep 9100LISTEN 0 32768 *:9100 *:* users :(("node_exporter",pid=115111 ,fd=3 ))
与 prometheus 集成:
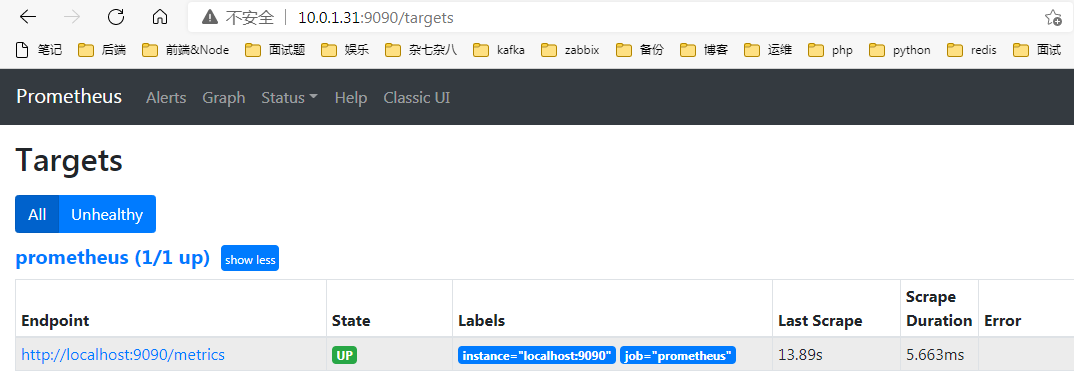
在 prometheus server 中添加一个 job:
1 2 3 4 5 6 7 8 9 10 11 12 13 14 15 16 17 [root@k8s-master prometheus ]$pwd /usr/local/prometheus [root@k8s-master prometheus ]$grep -v "#" prometheus.yml | grep -v "^$" global: alerting: alertmanagers: - static_configs: - targets: rule_files: scrape_configs: - job_name: 'prometheus' static_configs: - targets: ['localhost:9090' ] - job_name: 'promethues-node' metrics_path: '/metrics' static_configs: - targets: ['10.0.1.31:9100' , '10.0.1.32:9100' , '10.0.1.33:9100' ]
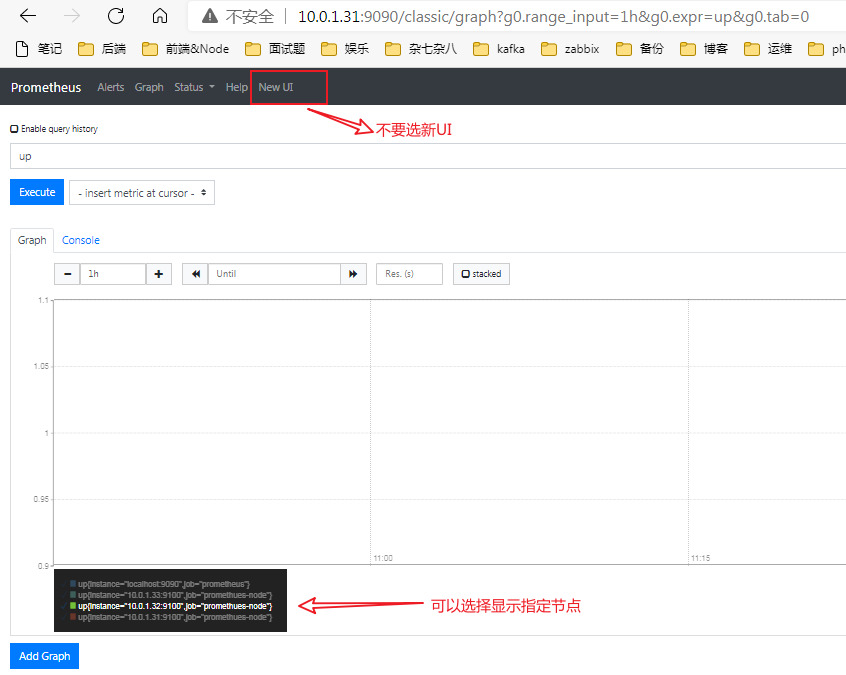
重启 prometheus ,等一会然后观察监控情况:
haproxy exporter 除了 node_exporter,官方还提供了监控 haproxy 的 exporter
需要将其部署在 haproxy 服务所在的节点
1 tar xvf haproxy_exporter-0.12.0.linux-amd64.tar.gz
prometheus 添加 haproxy 数据采集
1 2 3 - job_name: "prometheus-haproxy" static_configs: - targets: ["192.168.7.108:9101" ]
grafana 添加模板
367 2428
其他 exporter 如果官方没有提供监控相应服务的 exporter,需要使用第三方或自己开发
https://github.com/zhangguanzhang/harbor_exporter https://github.com/nginxinc/nginx-prometheus-exporter/
Grafana 调用 prometheus 的数据,进行更专业的可视化
cAdvisor https://www.oschina.net/p/cadvisor
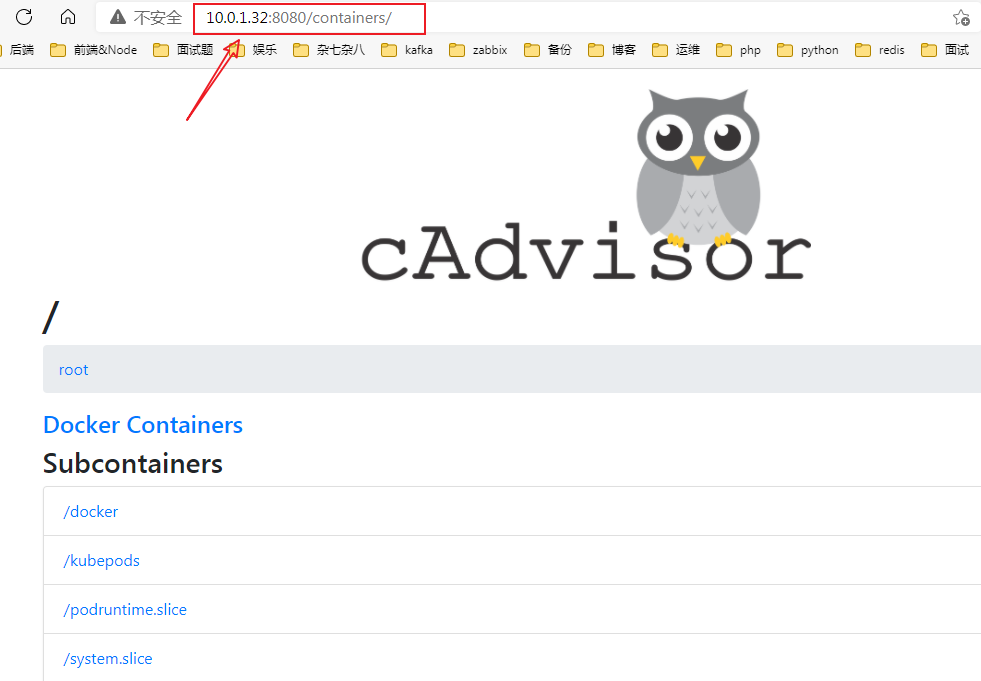
cAdvisor 是由谷歌开源的 docker 容器性能分析工具,cAdvisor 可以对节点机器上的资源及容器进行实时监控和性能数据采集,包括 CPU 使用情况、内存使用情况、网络吞吐量及文件系统使用情况,cAdvisor 不仅可以搜集一台机器上所有运行的容器信息,还提供基础查询界面和 http 接口,方便其他组件如 prometheus 进行数据抓取
k8s1.12 之前 cadvisor 集成在 node 节点的上 kubelet 服务中,从 1.12 版本开始分离为两个组件,因此需要在 node 节点单独部署 cadvisor
官方 github 给出部署方法,可是需要 pull 国外的镜像
1 2 3 4 5 6 7 8 9 10 11 12 13 14 15 16 17 18 19 $docker load -i cadvisor_v0.36.0.tar.gz$docker tag gcr.io/google_containers/cadvisor:v0.36.0 harbor.ljk.local/k8s/cadvisor:v0.36.0$docker push harbor.ljk.local/k8s/cadvisor:v0.36.0VERSION=v0.36.0 sudo docker run \ --volume=/:/rootfs:ro \ --volume=/var/run:/var/run:ro \ --volume=/sys:/sys:ro \ --volume=/var/lib/docker/:/var/lib/docker:ro \ --volume=/dev/disk/:/dev/disk:ro \ --publish=8080:8080 \ --detach=true \ --name=cadvisor \ --privileged \ --device=/dev/kmsg \ harbor.ljk.local/k8s/cadvisor:${VERSION}
prometheus 采集 cadvisor 数据 1 2 3 4 5 6 7 8 9 10 11 12 13 14 15 16 17 18 19 [root@k8s-master prometheus ]$grep -v "#" prometheus.yml | grep -v "^$" global: alerting: alertmanagers: - static_configs: - targets: rule_files: scrape_configs: - job_name: 'prometheus' static_configs: - targets: ['localhost:9090' ] - job_name: 'promethues-node' metrics_path: '/metrics' static_configs: - targets: ['10.0.1.31:9100' , '10.0.1.32:9100' , '10.0.1.33:9100' ] - job_name: 'promethues-containers' metrics_path: '/metrics' static_configs: - targets: ['10.0.1.32:8080' , '10.0.1.33:8080' ]
grafana 添加 pod 监控模板 395 893 容器模板 ID
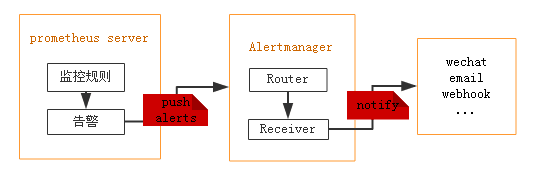
prometheus 报警设置 prometheus 触发一条告警的过程:
1 2 3 4 5 prometheus-->触发阈值-->超出持续时间-->alertmanager-->分组|抑制|静默-->媒体类型-->邮件|钉钉|微信等 分组(group): 将类似性质的警报合并为单个通知 静默(silences): 是一种简单的特定时间静音的机制,例如:服务器要升级维护可以先设置这个时间段告警静默 抑制(inhibition): 当警报发出后,停止重复发送由此警报引发的其他警报即合并一个故障引起的多个报警事件,可以消除冗余告警
安装 alertmanager 1 2 3 [root@k8s-master src]$tar zxf alertmanager-0.21.0.linux-amd64.tar.gz [root@k8s-master src]$mv alertmanager-0.21.0.linux-amd64 /usr/local/alertmanager [root@k8s-master src]$cd /usr/local/alertmanager/
配置 alertmanager 官方配置文档:https://prometheus.io/docs/alerting/configuration/
1 2 3 4 5 6 7 8 9 10 11 12 13 14 15 16 17 18 19 20 21 22 23 24 25 26 27 [root@k8s-master alertmanager ]$cat alertmanager.yml global: resolve_timeout: 5m smtp_smarthost: "smtp.qq.com:465" smtp_from: "441757636@qq.com" smtp_auth_username: "441757636@qq.com" smtp_auth_password: "udwthuyxjstcdhcj" smtp_hello: "@qq.com" smtp_require_tls: false route: group_by: ["alertname" ] group_wait: 10s group_interval: 10s repeat_interval: 2m receiver: "web.hook" receivers: - name: "web.hook" email_configs: - to: "2973707860@qq.com" inhibit_rules: - source_match: severity: "critical" target_match: severity: "warning" equal: ["alertname" , "dev" , "instance" ]
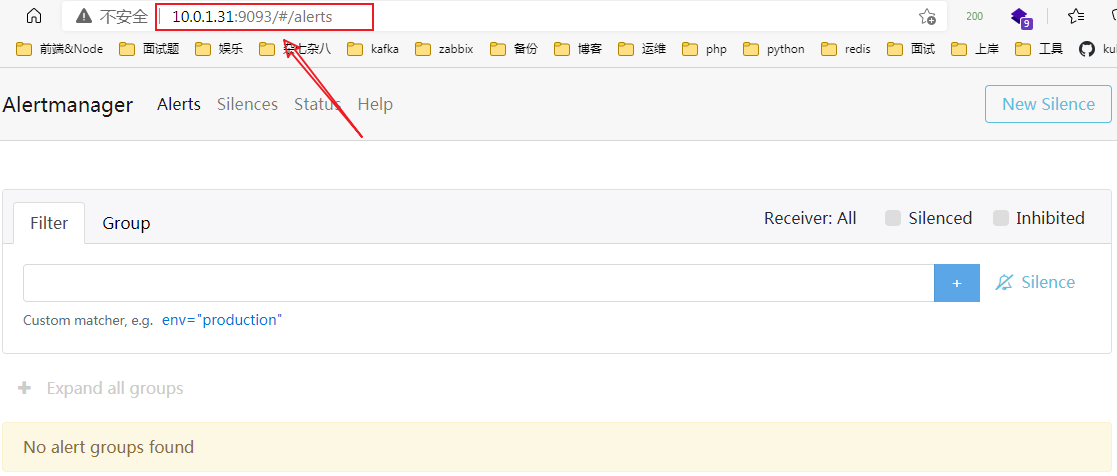
启动 alertmanager 1 2 3 4 5 6 7 8 9 10 11 12 13 14 15 16 17 18 19 $./alertmanager --config.file=./alertmanager.yml $vim /lib/systemd/system/alertmanager.service[Unit] Description=Prometheus Server Documentation=https://prometheus.io/docs/introduction/overview/ After=network.target [Service] Restart=on-failure WorkingDirectory=/usr/local/prometheus/ ExecStart=/usr/local/prometheus/prometheus --config.file=/usr/local/prometheus/prometheus.yml [Install] WantedBy=multi-user.target $lsof -i:9093 COMMAND PID USER FD TYPE DEVICE SIZE/OFF NODE NAME alertmana 53151 root 9u IPv6 195688 0t0 TCP *:9093 (LISTEN)
报警规则文件示例 1 2 3 4 5 6 7 8 groups: - name: rules: - alert: expr: for: labels: annotations:
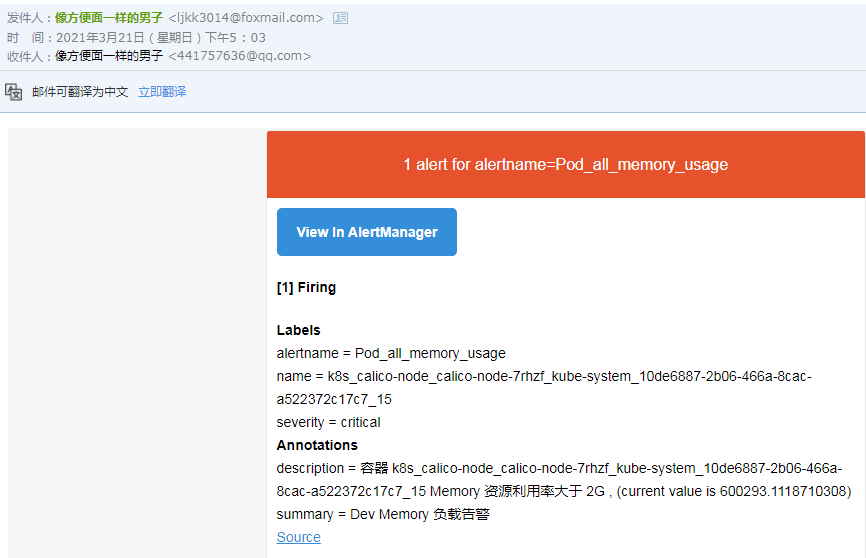
1 2 3 4 5 6 7 8 9 10 11 12 13 14 15 16 17 18 19 20 21 22 23 24 25 26 27 28 29 30 [root@k8s-master prometheus ]$pwd /usr/local/prometheus [root@k8s-master prometheus ]$vim rule.yml groups: - name: linux_pod.rules rules: - alert: Pod_all_cpu_usage expr: (sum by(name)(rate(container_cpu_usage_seconds_total{image!=""}[5m]))*100) > 75 for: 5m labels: severity: critical service: pods annotations: description: 容器 {{ $labels.name }} CPU 资源利用率大于 75 % , (current value is {{ $value }}) summary: Dev CPU 负载告警 - alert: Pod_all_memory_usage expr: sort_desc(avg by(name)(irate(container_memory_usage_bytes{name!=""}[5m]))*100) > 1024 *10^3*2 for: 10m labels: severity: critical annotations: description: 容器 {{ $labels.name }} Memory 资源利用率大于 2G , (current value is {{ $value }}) summary: Dev Memory 负载告警 - alert: Pod_all_network_receive_usage expr: sum by (name)(irate(container_network_receive_bytes_total{container_name="POD"}[1m])) > 1024 *1024*50 for: 10m labels: severity: critical annotations: description: 容器 {{ $labels.name }} network_receive 资源利用率大于 50M , (current value is {{ $value }})
配置 prometheus 1 2 3 4 5 6 7 8 9 10 11 12 13 14 15 16 17 18 19 20 21 22 $cat prometheus.yml ... alerting: alertmanagers: - static_configs: - targets: - 10.0 .1 .31 :9093 rule_files: - "/usr/local/prometheus/rule.yml" ... [root@k8s-master prometheus ]$./promtool check rules ./rule.yml Checking ./rule.yml SUCCESS: 3 rules found [root@k8s-master prometheus ]$systemctl restart prometheus